第8章周期関数Periodic Functions
Graphing Variations of y = sin x and y = cos xy = sin x と y = cos x を変形したもののグラフを描く
Throughout this section, we have learned about types of variations of sine and cosine functions and used that information to write equations from graphs. Now we can use the same information to create graphs from equations.
この節を通して、正弦関数と余弦関数の変形の種類を学び、その知識を使ってグラフから式を書いた。同じ知識を使えば、式からグラフを作れる。
Instead of focusing on the general form equations
一般形の式
we will let and and work with a simplified form of the equations in the following examples.
に目を向ける代わりに、次の例では かつ とし、簡単にした形の式で扱う。
How To手順
Given the function sketch its graph.
関数 が与えられたとき、そのグラフの概形を描く。
1. Identify the amplitude, 2. Identify the period, 3. Start at the origin, with the function increasing to the right if is positive or decreasing if is negative.4. At there is a local maximum for or a minimum for with 5. The curve returns to the x-axis at 6. There is a local minimum for (maximum for ) at with 7. The curve returns again to the x-axis at
1. 振幅 を見分ける。2. 周期 を見分ける。3. 原点から始める。 が正なら右へ増加、 が負なら減少する。4. では、 なら局所の最大値、 なら最小値があり、 となる。5. 曲線は で x軸に戻る。6. で の局所の最小値( なら最大値)があり、 となる。7. 曲線は で再び x軸に戻る。
Example 8例8
Graphing a Function and Identifying the Amplitude and Period関数のグラフを描き、振幅と周期を見分ける
Sketch a graph of
のグラフの概形を描け。
Solution 解答
Let’s begin by comparing the equation to the form
まず、この式を の形と比べよう。
• Step 1. We can see from the equation that so the amplitude is 2. • Step 2. The equation shows that so the period is • Step 3. Because is negative, the graph descends as we move to the right of the origin.• Step 4–7. The x-intercepts are at the beginning of one period, the horizontal midpoints are at and at the end of one period at
・手順1。この式から と分かるので、振幅は2である。・手順2。この式は を示しているので、周期は である。・手順3。 が負なので、原点から右へ動くとグラフは下がる。・手順4〜7。x切片は1周期の初め にあり、横の中点は 、1周期の終わりは にある。
The quarter points include the minimum at and the maximum at A local minimum will occur 2 units below the midline, at and a local maximum will occur at 2 units above the midline, at Figure 19 shows the graph of the function.
四分点には、 の最小値と の最大値が含まれる。局所の最小値は中央線より2単位下の に、局所の最大値は中央線より2単位上の に現れる。図19にこの関数のグラフを示す。
![A graph of -2sin((pi/2)x). Graph has range of [-2,2], period of 4, and amplitude of 2.](img/87c94baabcaca962025703da93562cd288213cb7.jpg)
Try IT Feature #8確認問題 8
Sketch a graph of Determine the midline, amplitude, period, and phase shift.
のグラフの概形を描け。中央線・振幅・周期・位相のずれを決めよ。
How To手順
Given a sinusoidal function with a phase shift and a vertical shift, sketch its graph.
位相のずれと縦の移動を持つ正弦曲線状の関数が与えられたとき、そのグラフの概形を描く。
1. Express the function in the general form 2. Identify the amplitude, 3. Identify the period, 4. Identify the phase shift, 5. Draw the graph of shifted to the right or left by and up or down by
1. この関数を一般形 で表す。2. 振幅 を見分ける。3. 周期 を見分ける。4. 位相のずれ を見分ける。5. を右か左に 、上か下に 移したグラフを描く。
Example 9例9
Graphing a Transformed Sinusoid変形した正弦曲線のグラフを描く
Sketch a graph of
のグラフの概形を描け。
Solution 解答
• Step 1. The function is already written in general form: This graph will have the shape of a sine function, starting at the midline and increasing to the right.• Step 2. The amplitude is 3.• Step 3. Since we determine the period as follows. The period is 8.• Step 4. Since the phase shift is The phase shift is 1 unit.• Step 5. Figure 20 shows the graph of the function. Figure 20 A horizontally compressed, vertically stretched, and horizontally shifted sinusoid
・手順1。この関数はすでに一般形 で書かれている。このグラフは正弦関数の形をとり、中央線から始まって右へ増加する。・手順2。。振幅は3である。・手順3。 なので、周期を次のように決める。。周期は8である。・手順4。 なので、位相のずれは である。位相のずれは1単位である。・手順5。図20にこの関数のグラフを示す。図20 横に縮み、縦に伸び、横に移った正弦曲線
Try IT Feature #9確認問題 9
Draw a graph of Determine the midline, amplitude, period, and phase shift.
のグラフを描け。中央線・振幅・周期・位相のずれを決めよ。
Example 10例10
Identifying the Properties of a Sinusoidal Function正弦曲線状の関数の性質を見分ける
Given determine the amplitude, period, phase shift, and vertical shift. Then graph the function.
が与えられたとき、振幅・周期・位相のずれ・縦の移動を決めよ。そしてこの関数のグラフを描け。
Solution 解答
Begin by comparing the equation to the general form and use the steps outlined in Example 9.
まずこの式を一般形と比べ、例9で述べた手順を使う。
• Step 1. The function is already written in general form.• Step 2. Since the amplitude is • Step 3. so the period is The period is 4.• Step 4. so we calculate the phase shift as The phase shift is • Step 5. so the midline is and the vertical shift is up 3.
・手順1。この関数はすでに一般形で書かれている。・手順2。 なので、振幅は である。・手順3。 なので、周期は である。周期は4である。・手順4。 なので、位相のずれを と計算する。位相のずれは である。・手順5。 なので、中央線は 、縦の移動は上に3である。
Since is negative, the graph of the cosine function has been reflected about the x-axis.
が負なので、余弦関数のグラフは x軸に関して折り返されている。
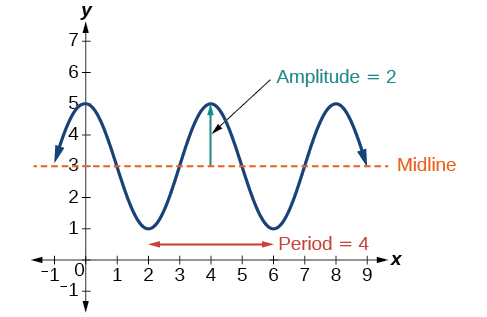
Figure 21 shows one cycle of the graph of the function.
図21にこの関数のグラフの1周期を示す。