第8章周期関数Periodic Functions
Graphing Variations of y = cot xy = cot x を変形したもののグラフを描く
We can transform the graph of the cotangent in much the same way as we did for the tangent. The equation becomes the following.
余接のグラフも、正接でしたのとほぼ同じように変形できる。式は次のようになる。
Note重要事項
Features of the Graph of y = Acot(Bx−C)+Dy = Acot(Bx−C)+D のグラフの特徴
• The stretching factor is • The period is • The domain is where is an integer.• The range is • The vertical asymptotes occur at where is an integer.• There is no amplitude.• is an odd function because it is the quotient of even and odd functions (cosine and sine, respectively)
・伸びの倍率は である。・周期は である。・定義域は、 を整数として である。・値域は である。・垂直漸近線は、 を整数として に現れる。・振幅は無い。・ は、偶関数と奇関数(それぞれ余弦と正弦)の商なので奇関数である。
How To手順
Given a modified cotangent function of the form graph one period.
の形に変えた余接関数が与えられたとき、1周期分のグラフを描く。
1. Express the function in the form 2. Identify the stretching factor, 3. Identify the period, 4. Draw the graph of 5. Plot any two reference points.6. Use the reciprocal relationship between tangent and cotangent to draw the graph of 7. Sketch the asymptotes.
1. この関数を の形で表す。2. 伸びの倍率 を見分ける。3. 周期 を見分ける。4. のグラフを描く。5. 目印の点を二つ打つ。6. 正接と余接の逆数の関係を使って、 のグラフを描く。7. 漸近線の概形を描く。
Example 8例8
Graphing Variations of the Cotangent Function余接関数を変形したもののグラフを描く
Determine the stretching factor, period, and phase shift of and then sketch a graph.
の伸びの倍率・周期・位相のずれを決め、グラフの概形を描け。
Solution 解答
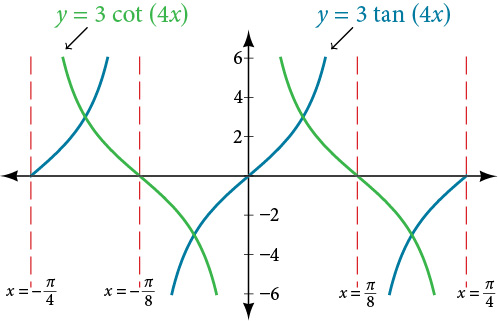
• Step 1. Expressing the function in the form gives • Step 2. The stretching factor is • Step 3. The period is • Step 4. Sketch the graph of • Step 5. Plot two reference points. Two such points are and • Step 6. Use the reciprocal relationship to draw • Step 7. Sketch the asymptotes,
・手順1。この関数を の形で表すと になる。・手順2。伸びの倍率は である。・手順3。周期は である。・手順4。 のグラフの概形を描く。・手順5。目印の点を二つ打つ。そうした点として と がある。・手順6。逆数の関係を使って を描く。・手順7。漸近線 の概形を描く。
The blue graph in Figure 14 shows and the green graph shows
図14の青いグラフは 、緑のグラフは を示している。
How To手順
Given a modified cotangent function of the form graph one period.
の形に変えた余接関数が与えられたとき、1周期分のグラフを描く。
1. Express the function in the form 2. Identify the stretching factor, 3. Identify the period, 4. Identify the phase shift, 5. Draw the graph of shifted to the right by and up by 6. Sketch the asymptotes where is an integer.7. Plot any three reference points and draw the graph through these points.
1. この関数を の形で表す。2. 伸びの倍率 を見分ける。3. 周期 を見分ける。4. 位相のずれ を見分ける。5. を右に 、上に 移したグラフを描く。6. を整数として、漸近線 の概形を描く。7. 目印の点を三つ打ち、その点を通るグラフを描く。
Example 9例9
Graphing a Modified Cotangent変えた余接のグラフを描く
Sketch a graph of one period of the function
関数 の1周期分のグラフの概形を描け。
Solution 解答
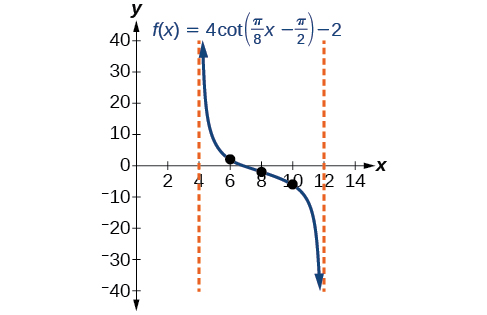
• Step 1. The function is already written in the general form • Step 2. so the stretching factor is 4.• Step 3. so the period is • Step 4. so the phase shift is • Step 5. We draw • Step 6-7. Three points we can use to guide the graph are and We use the reciprocal relationship of tangent and cotangent to draw • Step 8. The vertical asymptotes are and
・手順1。この関数はすでに一般形 で書かれている。・手順2。 なので、伸びの倍率は4である。・手順3。 なので、周期は である。・手順4。 なので、位相のずれは である。・手順5。 を描く。・手順6〜7。グラフの手がかりに使える点は と である。正接と余接の逆数の関係を使って を描く。・手順8。垂直漸近線は と である。
The graph is shown in Figure 15.
グラフを図15に示す。