第8章周期関数Periodic Functions
Analyzing the Graph of y = tan xy = tan x のグラフを調べる
We will begin with the graph of the tangent function, plotting points as we did for the sine and cosine functions. Recall that
まず正接関数のグラフから始め、正弦関数と余弦関数でしたのと同じように点を打つ。次を思い出そう。
The period of the tangent function is because the graph repeats itself on intervals of where is a constant. If we graph the tangent function on to we can see the behavior of the graph on one complete cycle. If we look at any larger interval, we will see that the characteristics of the graph repeat.
正接関数の周期は である。 を定数として、グラフが の間隔で繰り返すからである。 から まで正接関数のグラフを描けば、1周期分のグラフの特徴が見てとれる。もっと広い区間を見れば、グラフの特徴が繰り返すのが分かる。
We can determine whether tangent is an odd or even function by using the definition of tangent.
正接の定義を使えば、正接が奇関数か偶関数かを決められる。
Therefore, tangent is an odd function. We can further analyze the graphical behavior of the tangent function by looking at values for some of the special angles, as listed in Table 1.
したがって、正接は奇関数である。表1に挙げるような特別な角の値を見れば、正接関数のグラフの特徴をさらに調べられる。
| 0 | |||||||||
| undefined定義されない | –1 | 0 | 1 | undefined定義されない |
These points will help us draw our graph, but we need to determine how the graph behaves where it is undefined. If we look more closely at values when we can use a table to look for a trend. Because and we will evaluate at radian measures as shown in Table 2.
この点はグラフを描くのに役立つが、定義されないところでグラフがどうふるまうかを決める必要がある。 のときの値をもっとよく見れば、表を使って傾向を探せる。 かつ なので、表2に示すとおり、ラジアンでの大きさ で の値を求める。
| 1.3 | 1.5 | 1.55 | 1.56 | |
| 3.6 | 14.1 | 48.1 | 92.6 |
As approaches the outputs of the function get larger and larger. Because is an odd function, we see the corresponding table of negative values in Table 3.
が に近づくにつれて、この関数の出力はどんどん大きくなる。 は奇関数なので、表3に対応する負の値の表を示す。
| −1.3 | −1.5 | −1.55 | −1.56 | |
| −3.6 | −14.1 | −48.1 | −92.6 |
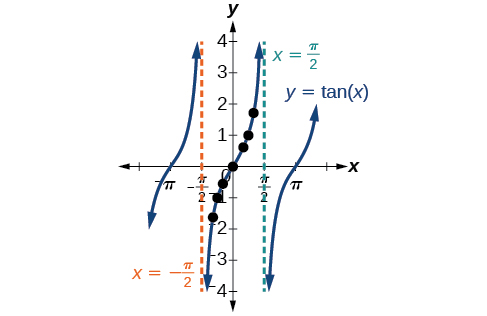
We can see that, as approaches the outputs get smaller and smaller. Remember that there are some values of for which For example, and At these values, the tangent function is undefined, so the graph of has discontinuities at At these values, the graph of the tangent has vertical asymptotes. Figure 1 represents the graph of The tangent is positive from 0 to and from to corresponding to quadrants I and III of the unit circle.
が に近づくにつれて、出力がどんどん小さくなるのが見てとれる。 となる の値がいくつかあることを思い出そう。たとえば と である。この値で正接関数は定義されないので、 のグラフは で不連続になる。この値で、正接のグラフは垂直漸近線を持つ。図1は のグラフを表している。正接は0から まで、そして から まで正であり、これは単位円の第I象限と第III象限に対応する。