第3章加速度Acceleration原書 p.97–120
Test Prep実力テスト
Multiple Choice選択問題
3.1 Acceleration 17Which variable represents displacement?a. ab. d
3.1 加速度 17変位を表す変数はどれか。a. ab. d
c. td. v
c. td. v
18If a velocity increases from 0 to 20 m/s in 10 s, what is the average acceleration?a. 0.5 m/s2b. 2 m/s2c. 10 m/s2d. 30 m/s2
18速度が10秒で0から20 m/sに増えたとき、平均加速度はいくらか。a. 0.5 m/s2b. 2 m/s2c. 10 m/s2d. 30 m/s2
3.2 Representing Acceleration with Equations and Graphs 19For the motion of a falling object, which graphs are straight lines?
3.2 式とグラフで加速度を表す 19落下する物体の運動について、直線になるグラフはどれか。
Short Answer記述式
3.1 Acceleration 21True or False—The vector for a negative acceleration points in the opposite direction when compared to the vector for a positive acceleration.
3.1 加速度 21正誤問題——負の加速度を表すベクトルは、正の加速度を表すベクトルと比べて逆向きを指す。
a. Trueb. False
a. 正b. 誤
22If a car decelerates from to in , what is ?a. –5 m/sb. –1 m/s
22ある車がの間にからへ減速したとき、はいくらか。a. −5 m/sb. −1 m/s
c. 1 m/sd. 5 m/s
c. 1 m/sd. 5 m/s
23How is the vector arrow representing an acceleration of magnitude 3 m/s2 different from the vector arrow representing a negative acceleration of magnitude 3 m/s2?
23大きさ3 m/s2の加速度を表すベクトルの矢印は、大きさ3 m/s2の負の加速度を表すベクトルの矢印とどう違うか。
a. They point in the same direction.b. They are perpendicular, forming a 90°
a. 同じ向きを指す。b. 互いに垂直で、90°の
time data to calculate velocity, average velocity, and acceleration? Which kinematic equations would you use?(c) How would you use the materials, the measured and calculated data, and the flat area below the slope to determine the negative acceleration? What would you measure, and which kinematic equation would you use?
時間のデータを使って、速度、平均速度、加速度をどう計算するか。どの運動学の式を使うか。(c)材料、測定した値と計算した値、そして坂の下の平らな区域を使って、負の加速度をどう求めるか。何を測り、どの運動学の式を使うか。
a. Acceleration versus time onlyb. Displacement versus time onlyc. Displacement versus time and acceleration versus timed. Velocity versus time and acceleration versus time
a. 加速度–時間だけb. 変位–時間だけc. 変位–時間と加速度–時間d. 速度–時間と加速度–時間
20A bullet in a gun is accelerated from the firing chamber to the end of the barrel at an average rate of 6.30×10⁵ m/s2 for 8.10×10⁻⁴ s. What is the bullet’s final velocity when it leaves the barrel, commonly known as the muzzle velocity?a. 7.79 m/sb. 51.0 m/s
20銃の中の弾丸が、薬室から銃身の先端まで、平均6.30×10⁵ m/s2の割合で8.10×10-4秒間加速される。銃身を出るときの弾丸の終わりの速度、すなわち銃口初速はいくらか。a. 7.79 m/sb. 51.0 m/s
c. 510 m/sd. 1020 m/s
c. 510 m/sd. 1020 m/s
angle between each other.c. They point in opposite directions.d. They are perpendicular, forming a 270° angle between each other.
角をなす。c. 逆向きを指す。d. 互いに垂直で、270°の角をなす。
24How long does it take to accelerate from 8.0 m/s to 20.0 m/s at a rate of acceleration of 3.0 m/s2?a. 0.25 sb. 4.0 s
243.0 m/s2の加速度で8.0 m/sから20.0 m/sまで加速するのに何秒かかるか。a. 0.25 sb. 4.0 s
c. 9.33 sd. 36 s
c. 9.33 sd. 36 s
3.2 Representing Acceleration with Equations and Graphs 25If a plot of displacement versus time is linear, what can be said about the acceleration?
3.2 式とグラフで加速度を表す 25変位–時間のグラフが直線なら、加速度について何が言えるか。
a. Acceleration is 0.b. Acceleration is a non-zero constant.c. Acceleration is positive.d. Acceleration is negative.
a. 加速度は0である。b. 加速度は0でない一定値である。c. 加速度は正である。d. 加速度は負である。
26 .
26
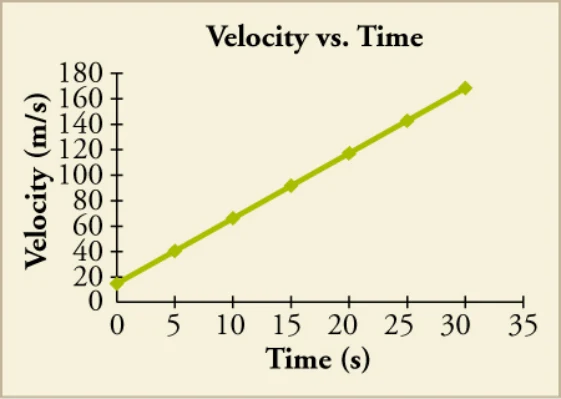
True or False: —The image shows a velocity vs. time graph for a jet car. If you take the slope at any point on the graph, the jet car’s acceleration will be 5.0 m/s2.
正誤問題——この図はジェット車の速度–時間グラフである。グラフ上のどの点で傾きをとっても、ジェット車の加速度は5.0 m/s2になる。
a. Trueb. False
a. 正b. 誤
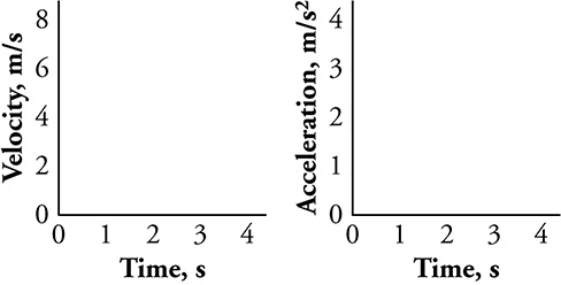
27When plotted on the blank plots, which answer choice would show the motion of an object that has uniformly accelerated from 2 m/s to 8 m/s in 3 s?
273秒で2 m/sから8 m/sまで一様に加速した物体の運動を、空欄のグラフに描いたとき、正しいのはどれか。
Extended Response論述式
3.1 Acceleration 29A test car carrying a crash test dummy accelerates from to and then crashes into a brick wall. Describe the direction of the initial acceleration vector and compare the initial acceleration vector’s magnitude with respect to the acceleration magnitude at the moment of the crash.
3.1 加速度 29衝突試験用人形を乗せた試験車がからまで加速し、それからレンガの壁に衝突する。初めの加速度ベクトルの向きを述べ、その大きさを衝突の瞬間の加速度の大きさと比べよ。
a. The direction of the initial acceleration vector will point towards the wall, and its magnitude will be less than the acceleration vector of the crash.b. The direction of the initial acceleration vector will point away from the wall, and its magnitude will be less than the vector of the crash.c. The direction of the initial acceleration vector will point towards the wall, and its magnitude will be more than the
a. 初めの加速度ベクトルは壁のほうを向き、その大きさは衝突時の加速度ベクトルより小さい。b. 初めの加速度ベクトルは壁と反対を向き、その大きさは衝突時のベクトルより小さい。c. 初めの加速度ベクトルは壁のほうを向き、その大きさは衝突時の加速度ベクトルより
a. The plot on the left shows a line from (0,2) to (3,8) while the plot on the right shows a line from (0,2) to (3,2).b. The plot on the left shows a line from (0,2) to (3,8) while the plot on the right shows a line from (0,3) to (3,3).c. The plot on the left shows a line from (0,8) to (3,2) while the plot on the right shows a line from (0,2) to (3,2).d. The plot on the left shows a line from (0,8) to (3,2) while the plot on the right shows a line from (0,3) to (3,3).
a. 左のグラフは(0,2)から(3,8)への直線、右のグラフは(0,2)から(3,2)への直線。b. 左のグラフは(0,2)から(3,8)への直線、右のグラフは(0,3)から(3,3)への直線。c. 左のグラフは(0,8)から(3,2)への直線、右のグラフは(0,2)から(3,2)への直線。d. 左のグラフは(0,8)から(3,2)への直線、右のグラフは(0,3)から(3,3)への直線。
28When is a plot of velocity versus time a straight line and when is it a curved line?
28速度–時間のグラフが直線になるのはどんなときで、曲線になるのはどんなときか。
a. It is a straight line when acceleration is changing and is a curved line when acceleration is constant.b. It is a straight line when acceleration is constant and is a curved line when acceleration is changing.c. It is a straight line when velocity is constant and is a curved line when velocity is changing.d. It is a straight line when velocity is changing and is a curved line when velocity is constant.
a. 加速度が変わっているときは直線、加速度が一定のときは曲線になる。b. 加速度が一定のときは直線、加速度が変わっているときは曲線になる。c. 速度が一定のときは直線、速度が変わっているときは曲線になる。d. 速度が変わっているときは直線、速度が一定のときは曲線になる。
acceleration vector of the crash. d. The direction of the initial acceleration vector will point away from the wall, and its magnitude will be more than the acceleration vector of the crash.
大きい。 d. 初めの加速度ベクトルは壁と反対を向き、その大きさは衝突時の加速度ベクトルより大きい。
30A car accelerates from rest at a stop sign at a rate of 3.0 m/s2 to a speed of 21.0 m/s, and then immediately begins to decelerate to a stop at the next stop sign at a rate of 4.0 m/s2. How long did it take the car to travel from the first stop sign to the second stop sign? Show your work.
30ある車が一時停止の標識のところで静止から3.0 m/s2の割合で加速して21.0 m/sの速さになり、そのあとただちに4.0 m/s2の割合で減速して、次の一時停止の標識で停止する。最初の標識から次の標識まで、車は何秒かかったか。計算過程も示せ。
a. 1.7 secondsb. 5.3 secondsc. 7.0 secondsd. 12 seconds
a. 1.7秒b. 5.3秒c. 7.0秒d. 12秒
3.2 Representing Acceleration with Equations and Graphs 31. True or False: Consider an object that starts from3.2 式とグラフで加速度を表す 31. 正誤問題——静止から動き出し、
119rest and moves with constant acceleration. The plot of displacement versus time for such motion is a curved line while the plot of displacement versus time squared is a straight line.
一定の加速度で動く物体を考える。この運動の変位–時間のグラフは曲線になり、変位を時間の2乗に対して描いたグラフは直線になる。
velocity of 15.0 m/s. It passes a tree branch on the way up at a height of 7.00 m. How much additional time will pass before the ball passes the tree branch on the way back down?
初速度15.0 m/sで。ボールは上昇の途中、高さ7.00 mのところで木の枝を通り過ぎる。落ちてくる途中で再びその枝を通り過ぎるまでに、さらに何秒かかるか。
a. Trueb. False
a. 正b. 誤
a. 0.574 sb. 0.956 sc. 1.53 sd. 1.91 s
a. 0.574 sb. 0.956 sc. 1.53 sd. 1.91 s
32You throw a ball straight up with an initial
32ボールをまっすぐ上に投げる。