第2章方程式と不等式Equations and Inequalities
2.1 The Rectangular Coordinate Systems and Graphs2.1 直交座標系とグラフ
Learning Objectives 学習目標
In this section, you will:
この節を終えると、次のことができるようになる。
• Plot ordered pairs in a Cartesian coordinate system.• Graph equations by plotting points.• Graph equations with a graphing utility.• Find x-intercepts and y-intercepts.• Use the distance formula.• Use the midpoint formula.
・デカルト座標系に順序対を打つ。・点を打って方程式のグラフを描く。・グラフ作成ツールで方程式のグラフを描く。・x切片と y切片を求める。・距離の公式を使う。・中点の公式を使う。
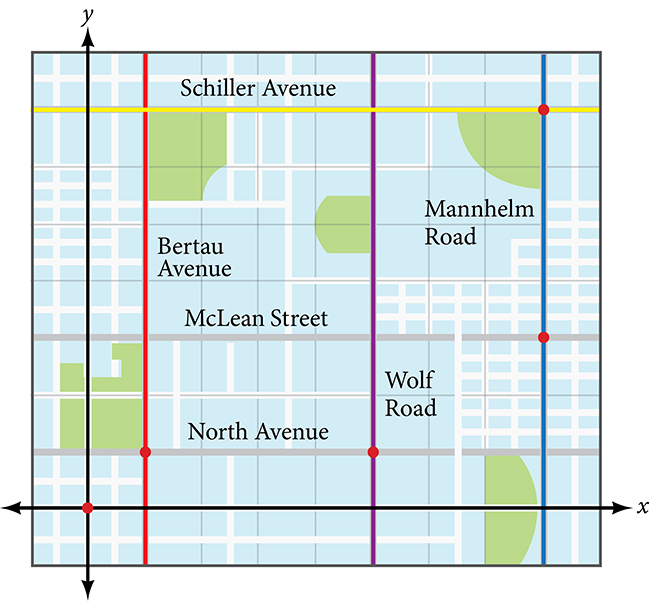
Tracie set out from Elmhurst, IL, to go to Franklin Park. On the way, she made a few stops to do errands. Each stop is indicated by a red dot in Figure 1. Laying a rectangular coordinate grid over the map, we can see that each stop aligns with an intersection of grid lines. In this section, we will learn how to use grid lines to describe locations and changes in locations.
トレーシーは、イリノイ州エルムハーストからフランクリンパークへ向かう途中、いくつかの場所に立ち寄って用事を済ませた。図1の赤い点は、その立ち寄り先を示している。地図に直交座標の格子を重ねると、各地点が格子線の交点に対応していることが分かる。この節では、格子を使って位置と位置の変化を表す方法を学ぶ。
Plotting Ordered Pairs in the Cartesian Coordinate Systemデカルト座標系に順序対を打つ
An old story describes how seventeenth-century philosopher/mathematician René Descartes, while sick in bed, invented the system that has become the foundation of algebra. According to the story, Descartes was staring at a fly crawling on the ceiling when he realized that he could describe the fly’s location in relation to the perpendicular lines formed by the adjacent walls of his room. He viewed the perpendicular lines as horizontal and vertical axes. Further, by dividing each axis into equal unit lengths, Descartes saw that it was possible to locate any object in a two-dimensional plane using just two numbers—the displacement from the horizontal axis and the displacement from the vertical axis.
17世紀の哲学者・数学者ルネ・デカルトが、病床で座標の考え方を思いついたという逸話がある。天井をはうハエを眺めていたデカルトは、隣り合う壁がつくる互いに直交する2本の線を基準にすれば、その位置を表せると気づいたという。この2本の線を横軸と縦軸とし、それぞれに等間隔の目盛りをつける。すると平面上の位置は、各軸からどれだけ離れているかを表す2つの数だけで指定できる。この仕組みが、代数を図形と結びつける基礎になった。
While there is evidence that ideas similar to Descartes’ grid system existed centuries earlier, it was Descartes who introduced the components that comprise the Cartesian coordinate system, a grid system having perpendicular axes. Descartes named the horizontal axis the x-axis and the vertical axis the y-axis.
Descartes の格子に似た考えは何世紀も前からあったという証拠もあるが、垂直な軸を持つ格子の仕組み、すなわちデカルト座標系を構成する要素を導き入れたのは Descartes である。彼は横の軸を x軸、縦の軸を y軸と名づけた。
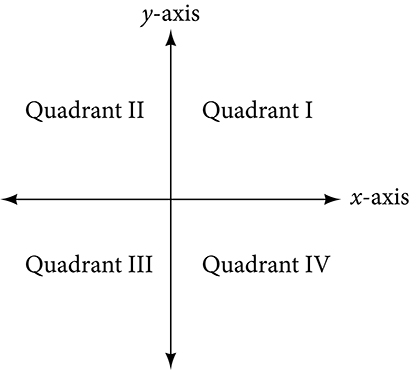
The Cartesian coordinate system, also called the rectangular coordinate system, is based on a two-dimensional plane consisting of the x-axis and the y-axis. Perpendicular to each other, the axes divide the plane into four sections. Each section is called a quadrant; the quadrants are numbered counterclockwise as shown in Figure 2
デカルト座標系は直交座標系ともいい、x軸と y軸からなる二次元平面をもとにしている。二つの軸は互いに垂直で、平面を四つの部分に分ける。それぞれの部分を象限といい、図2のように反時計回りに番号を振る。
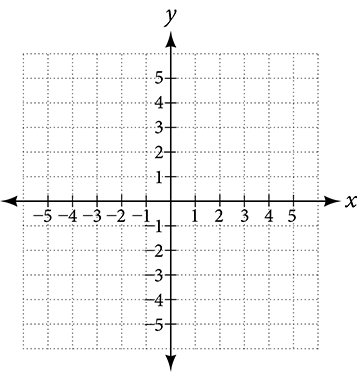
The center of the plane is the point at which the two axes cross. It is known as the origin, or point From the origin, each axis is further divided into equal units: increasing, positive numbers to the right on the x-axis and up the y-axis; decreasing, negative numbers to the left on the x-axis and down the y-axis. The axes extend to positive and negative infinity as shown by the arrowheads in Figure 3.
平面の中心は、二つの軸が交わる点である。これを原点、または点 という。原点から、それぞれの軸はさらに等しい目盛りに分けられる。x軸では右へ、y軸では上へ行くほど正の数が大きくなり、x軸では左へ、y軸では下へ行くほど負の数が小さくなる。図3の矢の先が示すように、軸は正と負の無限へ伸びている。
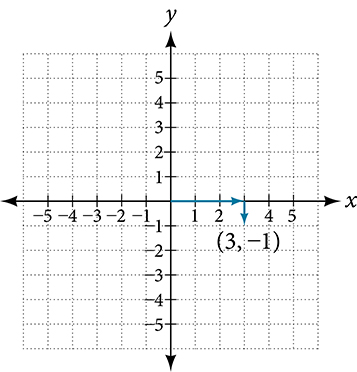
Each point in the plane is identified by its x-coordinate, or horizontal displacement from the origin, and its y-coordinate, or vertical displacement from the origin. Together, we write them as an ordered pair indicating the combined distance from the origin in the form An ordered pair is also known as a coordinate pair because it consists of x- and y-coordinates. For example, we can represent the point in the plane by moving three units to the right of the origin in the horizontal direction, and one unit down in the vertical direction. See Figure 4.
平面上の各点は、x座標(原点からの横のずれ)と y座標(原点からの縦のずれ)で定まる。この二つを合わせ、原点からのずれをまとめて の形の順序対として書く。順序対は x座標と y座標からなるので、座標の対ともいう。たとえば点 は、原点から横の向きに右へ3目盛り、縦の向きに下へ1目盛り動いた位置として平面上に表せる。図4を見よ。
When dividing the axes into equally spaced increments, note that the x-axis may be considered separately from the y-axis. In other words, while the x-axis may be divided and labeled according to consecutive integers, the y-axis may be divided and labeled by increments of 2, or 10, or 100. In fact, the axes may represent other units, such as years against the balance in a savings account, or quantity against cost, and so on. Consider the rectangular coordinate system primarily as a method for showing the relationship between two quantities.
軸を等間隔の目盛りに分けるとき、x軸と y軸は別々に考えてよいことに注意せよ。つまり x軸を連続する整数で分けて目盛りを振る一方で、y軸は2ずつ、10ずつ、100ずつに分けてもよい。実際、軸は別の単位を表してもよい。たとえば年に対する貯金口座の残高、数量に対する費用などである。直交座標系は、二つの量のあいだの関係を示す手立てだと考えるのがよい。
Cartesian Coordinate System 直交座標系
A two-dimensional plane where the
次のような二次元平面である。
• x-axis is the horizontal axis• y-axis is the vertical axis
・x軸は横の軸・y軸は縦の軸
A point in the plane is defined as an ordered pair, such that x is determined by its horizontal distance from the origin and y is determined by its vertical distance from the origin.
平面上の点は順序対 として定める。x は原点からの横の距離で、y は原点からの縦の距離で決まる。
Example 1例1
Plotting Points in a Rectangular Coordinate System直交座標系に点を打つ
Plot the points and in the plane.
点 、、 を平面上に打て。
Solution 解答
To plot the point begin at the origin. The x-coordinate is –2, so move two units to the left. The y-coordinate is 4, so then move four units up in the positive y direction.
点 を打つには、原点から始める。x座標は–2なので、左へ2目盛り動く。y座標は4なので、そこから y の正の向きに上へ4目盛り動く。
To plot the point begin again at the origin. The x-coordinate is 3, so move three units to the right. The y-coordinate is also 3, so move three units up in the positive y direction.
点 を打つには、また原点から始める。x座標は3なので、右へ3目盛り動く。y座標も3なので、y の正の向きに上へ3目盛り動く。
To plot the point begin again at the origin. The x-coordinate is 0. This tells us not to move in either direction along the x-axis. The y-coordinate is –3, so move three units down in the negative y direction. See the graph in Figure 5.
点 を打つには、また原点から始める。x座標は0である。これは x軸の向きにはどちらへも動かないことを意味する。y座標は–3なので、y の負の向きに下へ3目盛り動く。図5のグラフを見よ。
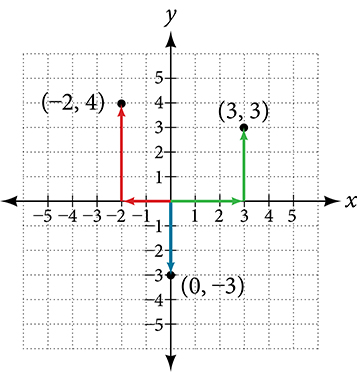
Analysis 考察
Note that when either coordinate is zero, the point must be on an axis. If the x-coordinate is zero, the point is on the y-axis. If the y-coordinate is zero, the point is on the x-axis.
どちらかの座標が0のとき、その点は必ず軸の上にあることに注意せよ。x座標が0なら点は y軸上にあり、y座標が0なら点は x軸上にある。
Graphing Equations by Plotting Points点を打って方程式のグラフを描く
We can plot a set of points to represent an equation. When such an equation contains both an x variable and a y variable, it is called an equation in two variables. Its graph is called a graph in two variables. Any graph on a two-dimensional plane is a graph in two variables.
点の集まりを打つことで方程式を表せる。そうした方程式に変数 x と変数 y の両方が入っているとき、それを二変数の方程式という。そのグラフを二変数のグラフという。二次元平面上のグラフはどれも二変数のグラフである。
Suppose we want to graph the equation We can begin by substituting a value for x into the equation and determining the resulting value of y. Each pair of x- and y-values is an ordered pair that can be plotted. Table 1 lists values of x from –3 to 3 and the resulting values for y.
方程式 のグラフを描きたいとしよう。まず x にある値を代入し、その結果の y の値を求めるところから始められる。x と y の値の組はどれも、平面に打てる順序対である。表1に、–3から3までの x の値と、それに対する y の値を並べる。
We can plot the points in the table. The points for this particular equation form a line, so we can connect them. See Figure 6. This is not true for all equations.
表の点を打てる。この方程式の点は直線をなすので、つなぐことができる。図6を見よ。すべての方程式でこうなるわけではない。
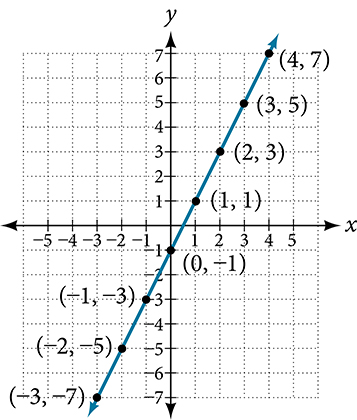
Note that the x-values chosen are arbitrary, regardless of the type of equation we are graphing. Of course, some situations may require particular values of x to be plotted in order to see a particular result. Otherwise, it is logical to choose values that can be calculated easily, and it is always a good idea to choose values that are both negative and positive. There is no rule dictating how many points to plot, although we need at least two to graph a line. Keep in mind, however, that the more points we plot, the more accurately we can sketch the graph.
どんな型の方程式のグラフを描くときでも、選ぶ x の値は自由であることに注意せよ。もちろん、ある結果を見るために特定の x の値を打つ必要がある場合もある。そうでなければ、計算が楽な値を選ぶのが理にかなっており、負の値と正の値の両方を選ぶのがつねによい。打つ点の数に決まりはないが、直線を描くには少なくとも二点が要る。ただし、打つ点が多いほどグラフを正確に描けることは覚えておこう。
How To 手順
Given an equation, graph by plotting points.
方程式が与えられたとき、点を打ってグラフを描く。
1. Make a table with one column labeled x, a second column labeled with the equation, and a third column listing the resulting ordered pairs.2. Enter x-values down the first column using positive and negative values. Selecting the x-values in numerical order will make the graphing simpler.3. Select x-values that will yield y-values with little effort, preferably ones that can be calculated mentally.4. Plot the ordered pairs.5. Connect the points if they form a line.
1. 一列目に x、二列目に方程式、三列目にできあがった順序対を書く表を作る。2. 一列目に、正と負の値を使って x の値を並べる。x の値を数の順に選ぶと、グラフを描くのが楽になる。3. y の値が手間なく求まる x の値、できれば暗算できるものを選ぶ。4. 順序対を打つ。5. 点が直線をなすならつなぐ。
Example 2例2
Graphing an Equation in Two Variables by Plotting Points点を打って二変数の方程式のグラフを描く
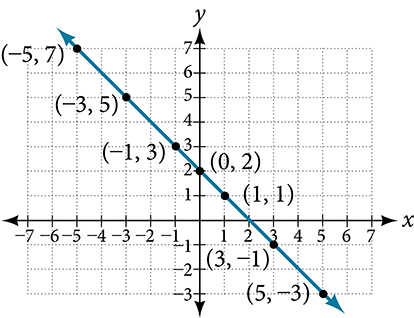
Graph the equation by plotting points.
点を打って方程式 のグラフを描け。
Try It #1やってみよう1
Construct a table and graph the equation by plotting points:
表を作り、点を打って方程式 のグラフを描け。
Graphing Equations with a Graphing Utilityグラフ作成ツールで方程式のグラフを描く
Most graphing calculators require similar techniques to graph an equation. The equations sometimes have to be manipulated so they are written in the style The TI-84 Plus, and many other calculator makes and models, have a mode function, which allows the window (the screen for viewing the graph) to be altered so the pertinent parts of a graph can be seen.
たいていのグラフ電卓は、方程式のグラフを描く手つきが似ている。方程式は の形に書き直さなければならないことがある。TI-84 Plus をはじめ多くの電卓には表示の設定があり、表示窓(グラフを見る画面)を変えてグラフの必要な部分が見えるようにできる。
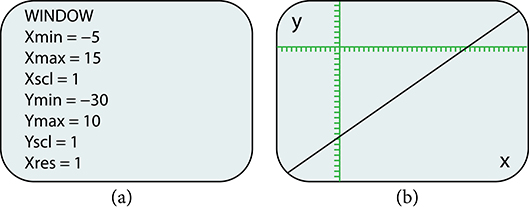
For example, the equation has been entered in the TI-84 Plus shown in Figure 8a. In Figure 8b, the resulting graph is shown. Notice that we cannot see on the screen where the graph crosses the axes. The standard window screen on the TI-84 Plus shows and See Figure 8c.
たとえば図8aの TI-84 Plus には方程式 が入力されている。図8bにその結果のグラフを示す。画面ではグラフが軸と交わる場所が見えていないことに注意せよ。TI-84 Plus の標準の表示窓は と の範囲を示す。図8cを見よ。
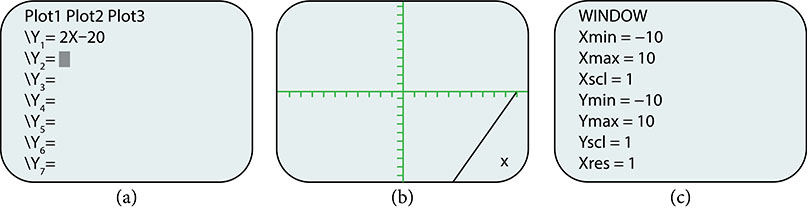
By changing the window to show more of the positive x-axis and more of the negative y-axis, we have a much better view of the graph and the x- and y-intercepts. See Figure 9a and Figure 9b.
表示窓を変えて x軸の正の側と y軸の負の側をより広く見せると、グラフと x切片・y切片がずっとよく見える。図9aと図9bを見よ。
Example 3例3
Using a Graphing Utility to Graph an Equationグラフ作成ツールで方程式のグラフを描く
Use a graphing utility to graph the equation:
グラフ作成ツールを使って方程式 のグラフを描け。
Solution 解答
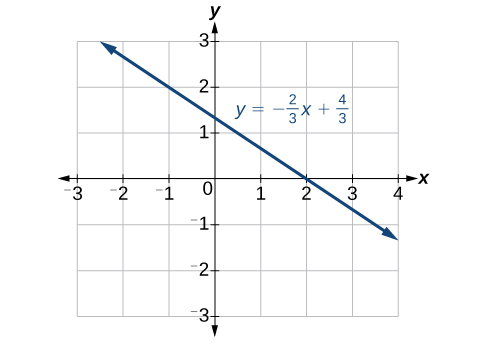
Enter the equation in the y= function of the calculator. Set the window settings so that both the x- and y- intercepts are showing in the window. See Figure 10.
電卓の y= の機能に方程式を入力する。x切片と y切片の両方が表示窓に入るように設定を整える。図10を見よ。
Finding x-intercepts and y-interceptsx切片と y切片を求める
The intercepts of a graph are points at which the graph crosses the axes. The x-intercept is the point at which the graph crosses the x-axis. At this point, the y-coordinate is zero. The y-intercept is the point at which the graph crosses the y-axis. At this point, the x-coordinate is zero.
グラフの切片とは、グラフが軸と交わる点のことである。x切片はグラフが x軸と交わる点である。この点では y座標が0になる。y切片はグラフが y軸と交わる点である。この点では x座標が0になる。
To determine the x-intercept, we set y equal to zero and solve for x. Similarly, to determine the y-intercept, we set x equal to zero and solve for y. For example, lets find the intercepts of the equation
x切片を求めるには、y を0とおいて x について解く。同じように、y切片を求めるには x を0とおいて y について解く。たとえば方程式 の切片を求めてみよう。
To find the x-intercept, set
x切片を求めるには とおく。
To find the y-intercept, set
y切片を求めるには とおく。
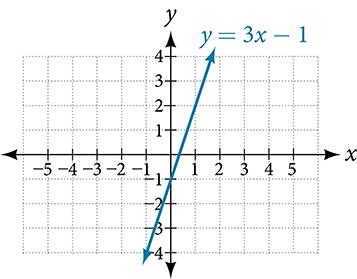
We can confirm that our results make sense by observing a graph of the equation as in Figure 11. Notice that the graph crosses the axes where we predicted it would.
図11のように方程式のグラフを見れば、結果が理にかなっていることを確かめられる。予想したとおりの場所でグラフが軸と交わっている。
Given an equation, find the intercepts. 方程式から切片を求める手順
• Find the x-intercept by setting and solving for • Find the y-intercept by setting and solving for
・ とおいて について解き、x切片を求める。・ とおいて について解き、y切片を求める。
Example 4例4
Finding the Intercepts of the Given Equation与えられた方程式の切片を求める
Find the intercepts of the equation Then sketch the graph using only the intercepts.
方程式 の切片を求めよ。そのうえで、切片だけを使ってグラフの概形を描け。
Solution 解答
Set to find the x-intercept.
とおいて x切片を求める。
Set to find the y-intercept.
とおいて y切片を求める。
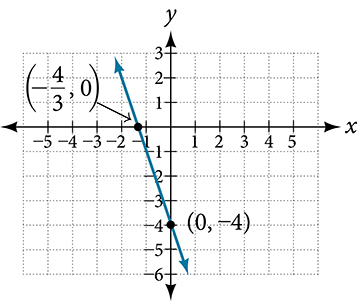
Plot both points, and draw a line passing through them as in Figure 12.
図12のように、両方の点を打ち、その二点を通る直線を引く。
Try It #2やってみよう2
Find the intercepts of the equation and sketch the graph:
方程式 の切片を求め、グラフの概形を描け。
Using the Distance Formula距離の公式を使う
Derived from the Pythagorean Theorem, the distance formula is used to find the distance between two points in the plane. The Pythagorean Theorem, is based on a right triangle where a and b are the lengths of the legs adjacent to the right angle, and c is the length of the hypotenuse. See Figure 13.
距離の公式はピタゴラスの定理から導かれ、平面上の二点間の距離を求めるのに使う。ピタゴラスの定理 は直角三角形をもとにしており、a と b は直角をはさむ二辺の長さ、c は斜辺の長さである。図13を見よ。
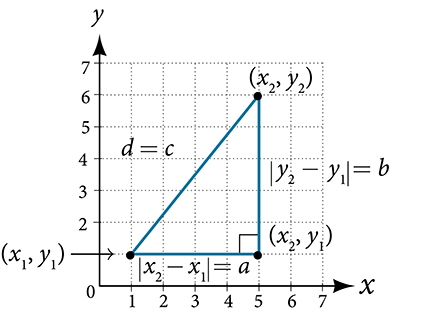
The relationship of sides and to side d is the same as that of sides a and b to side c. We use the absolute value symbol to indicate that the length is a positive number because the absolute value of any number is positive. (For example, ) The symbols and indicate that the lengths of the sides of the triangle are positive. To find the length c, take the square root of both sides of the Pythagorean Theorem.
辺 と の辺 d に対する関係は、辺 a と b の辺 c に対する関係と同じである。長さが正の数であることを示すために絶対値の記号を使う。どんな数の絶対値も正だからである(たとえば )。記号 と は、三角形の辺の長さが正であることを示している。長さ c を求めるには、ピタゴラスの定理の両辺の平方根をとる。
It follows that the distance formula is given as
したがって距離の公式は次のように与えられる。
We do not have to use the absolute value symbols in this definition because any number squared is positive.
この定義では絶対値の記号は要らない。どんな数も二乗すれば正になるからである。
The Distance Formula 2点間の距離の公式
Given endpoints and the distance between two points is given by
端点 と が与えられたとき、二点間の距離は次で与えられる。
Example 5例5
Finding the Distance between Two Points二点間の距離を求める
Find the distance between the points and
点 と のあいだの距離を求めよ。
Solution 解答
Let us first look at the graph of the two points. Connect the points to form a right triangle as in Figure 14.
まず二点のグラフを見よう。図14のように、点をつないで直角三角形を作る。
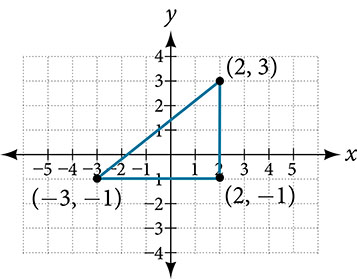
Then, calculate the length of d using the distance formula.
それから距離の公式を使って d の長さを計算する。
Try It #3やってみよう3
Find the distance between two points: and
二点 と のあいだの距離を求めよ。
Example 6例6
Finding the Distance between Two Locations二地点間の距離を求める
Let’s return to the situation introduced at the beginning of this section.
この節のはじめに出した場面に戻ろう。
Tracie set out from Elmhurst, IL, to go to Franklin Park. On the way, she made a few stops to do errands. Each stop is indicated by a red dot in Figure 1. Find the total distance that Tracie traveled. Compare this with the distance between her starting and final positions.
Tracie はイリノイ州 Elmhurst を出て Franklin Park へ向かった。途中、用事を済ませるために何度か立ち寄った。立ち寄った先は図1に赤い点で示してある。Tracie が走った道のりの合計を求めよ。それを、出発地と最終地のあいだの距離と比べよ。
Solution 解答
The first thing we should do is identify ordered pairs to describe each position. If we set the starting position at the origin, we can identify each of the other points by counting units east (right) and north (up) on the grid. For example, the first stop is 1 block east and 1 block north, so it is at The next stop is 5 blocks to the east, so it is at After that, she traveled 3 blocks east and 2 blocks north to Lastly, she traveled 4 blocks north to We can label these points on the grid as in Figure 15.
まずすべきは、それぞれの位置を表す順序対を決めることである。出発地を原点にとれば、格子の上で東(右)と北(上)へ何目盛りかを数えることで、ほかの点を決められる。たとえば最初の立ち寄り先は東へ1区画、北へ1区画なので にある。次の立ち寄り先は東へ5区画なので にある。その後、東へ3区画、北へ2区画進んで に至る。最後に北へ4区画進んで に着く。図15のように、これらの点を格子の上に書き入れられる。
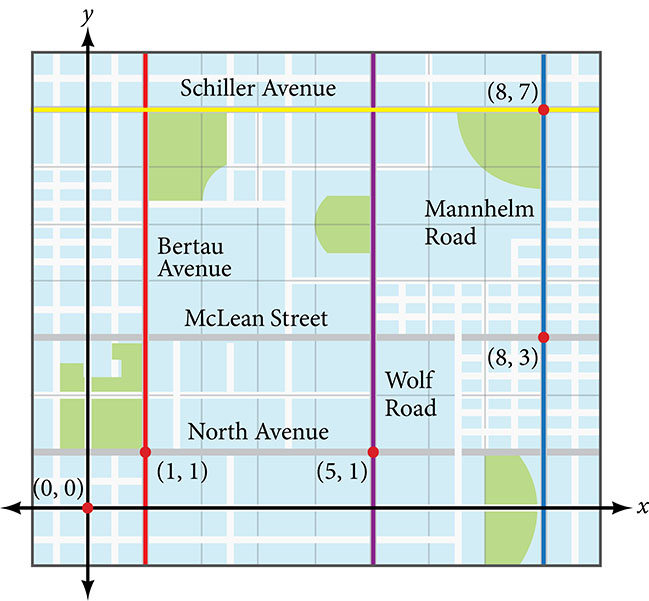
Next, we can calculate the distance. Note that each grid unit represents 1,000 feet.
次に距離を計算する。格子1目盛りが1,000フィートを表すことに注意せよ。
• From her starting location to her first stop at Tracie might have driven north 1,000 feet and then east 1,000 feet, or vice versa. Either way, she drove 2,000 feet to her first stop.• Her second stop is at So from to Tracie drove east 4,000 feet.• Her third stop is at There are a number of routes from to Whatever route Tracie decided to use, the distance is the same, as there are no angular streets between the two points. Let’s say she drove east 3,000 feet and then north 2,000 feet for a total of 5,000 feet.• Tracie’s final stop is at This is a straight drive north from for a total of 4,000 feet.
・出発地から最初の立ち寄り先 までは、Tracie は北へ1,000フィート進んでから東へ1,000フィート進んだかもしれないし、その逆かもしれない。どちらにしても、最初の立ち寄り先までに2,000フィート走った。・二つ目の立ち寄り先は にある。よって から まで、Tracie は東へ4,000フィート走った。・三つ目の立ち寄り先は にある。 から への道筋はいくつもある。二点のあいだに斜めの道は無いので、Tracie がどの道筋を選んでも距離は同じである。ここでは東へ3,000フィート、次に北へ2,000フィート走って合わせて5,000フィートとしよう。・Tracie の最後の立ち寄り先は にある。これは からまっすぐ北へ走るだけで、合わせて4,000フィートである。
Next, we will add the distances listed in Table 3.
次に、表3に並べた距離を足す。
| From/To区間 | Number of Feet Driven走った距離(フィート) |
|---|---|
| to から まで | 2,000 |
| to から まで | 4,000 |
| to から まで | 5,000 |
| to から まで | 4,000 |
| Total合計 | 15,000 |
The total distance Tracie drove is 15,000 feet, or 2.84 miles. This is not, however, the actual distance between her starting and ending positions. To find this distance, we can use the distance formula between the points and
Tracie が走った道のりの合計は15,000フィート、すなわち2.84マイルである。ただしこれは、出発地と到着地のあいだの実際の距離ではない。その距離を求めるには、点 と のあいだで距離の公式を使えばよい。
At 1,000 feet per grid unit, the distance between Elmhurst, IL, to Franklin Park is 10,630.14 feet, or 2.01 miles. The distance formula results in a shorter calculation because it is based on the hypotenuse of a right triangle, a straight diagonal from the origin to the point Perhaps you have heard the saying “as the crow flies,” which means the shortest distance between two points because a crow can fly in a straight line even though a person on the ground has to travel a longer distance on existing roadways.
格子1目盛りが1,000フィートなので、イリノイ州 Elmhurst から Franklin Park までの距離は10,630.14フィート、すなわち2.01マイルである。距離の公式の方が短い値になるのは、原点から点 へまっすぐ引いた斜めの線、つまり直角三角形の斜辺をもとにしているからである。「烏が飛ぶように」という言い回しを聞いたことがあるかもしれない。地上の人は既にある道路をたどって遠回りしなければならないが、烏はまっすぐ飛べる。だからこれは二点間の最短距離を意味する。
Using the Midpoint Formula中点の公式を使う
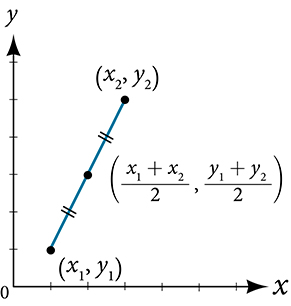
When the endpoints of a line segment are known, we can find the point midway between them. This point is known as the midpoint and the formula is known as the midpoint formula. Given the endpoints of a line segment, and the midpoint formula states how to find the coordinates of the midpoint
線分の両端が分かっているとき、そのちょうど真ん中の点を求められる。この点を中点といい、その公式を中点の公式という。線分の端点 と が与えられたとき、中点 の座標をどう求めるかを中点の公式が述べる。
A graphical view of a midpoint is shown in Figure 16. Notice that the line segments on either side of the midpoint are congruent.
中点をグラフで見たものを図16に示す。中点の両側の線分が合同であることに注意せよ。
Example 7例7
Finding the Midpoint of the Line Segment線分の中点を求める
Find the midpoint of the line segment with the endpoints and
端点が と である線分の中点を求めよ。
Solution 解答
Use the formula to find the midpoint of the line segment.
公式を使って線分の中点を求める。
Try It #4やってみよう4
Find the midpoint of the line segment with endpoints and
端点が と である線分の中点を求めよ。
Example 8例8
Finding the Center of a Circle円の中心を求める
The diameter of a circle has endpoints and Find the center of the circle.
ある円の直径の端点は と である。この円の中心を求めよ。
Solution 解答
The center of a circle is the center, or midpoint, of its diameter. Thus, the midpoint formula will yield the center point.
円の中心とは、その直径の真ん中、すなわち中点である。よって中点の公式で中心の点が求まる。
Media 教材
Access these online resources for additional instruction and practice with the Cartesian coordinate system.
デカルト座標系についての説明と練習をさらに求めるなら、次のオンライン教材にあたるとよい。
• Plotting points on the coordinate plane• Find x and y intercepts based on the graph of a line
・座標平面に点を打つ・直線のグラフから x切片と y切片を求める
Verbal言葉で答える問題
2. Describe the process for finding the x-intercept and the y-intercept of a graph algebraically.
2. グラフの x切片と y切片を、式の上で求める手順を述べよ。
4. When using the distance formula explain the correct order of operations that are to be performed to obtain the correct answer.
4. 距離の公式 を使うとき、正しい答えを得るためにどの順で計算すべきかを説明せよ。
Algebraic代数の問題
For each of the following exercises, find the x-intercept and the y-intercept without graphing. Write the coordinates of each intercept.
次の各問について、グラフを描かずに x切片と y切片を求めよ。それぞれの切片の座標を書け。
For each of the following exercises, solve the equation for y in terms of x.
次の各問について、方程式を y について x の式で解け。
For each of the following exercises, find the distance between the two points. Simplify your answers, and write the exact answer in simplest radical form for irrational answers.
次の各問について、二点間の距離を求めよ。答えは簡単にし、無理数になる場合は最も簡単な根号の形で正確な値を書け。
18. and
18. と
20. and
20. と
21. Find the distance between the two points given using your calculator, and round your answer to the nearest hundredth.
21. 電卓を使って与えられた二点間の距離を求め、答えを小数第二位まで四捨五入せよ。
and
と
For each of the following exercises, find the coordinates of the midpoint of the line segment that joins the two given points.
次の各問について、与えられた二点を結ぶ線分の中点の座標を求めよ。
22. and
22. と
24. and
24. と
26. and
26. と
Graphicalグラフの問題
For each of the following exercises, identify the information requested.
次の各問について、問われている情報を答えよ。
28. If a point is located on the y-axis, what is the x-coordinate?
28. 点が y軸上にあるとき、x座標はいくつか。
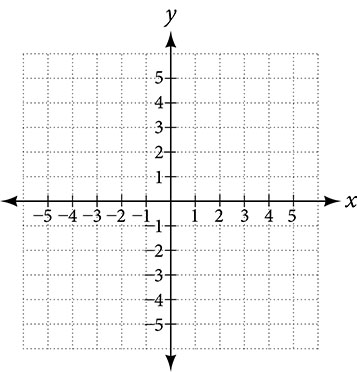
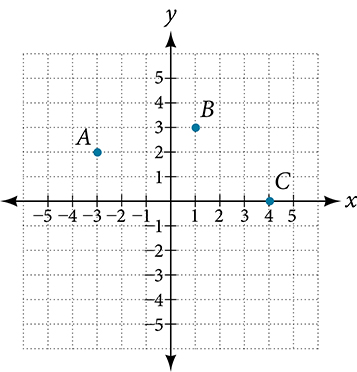
For each of the following exercises, plot the three points on the given coordinate plane. State whether the three points you plotted appear to be collinear (on the same line).
次の各問について、与えられた座標平面に三つの点を打て。打った三点が同一直線上にあるように見えるかどうかを述べよ。
34. Name the quadrant in which the following points would be located. If the point is on an axis, name the axis.
34. 次の各点がどの象限にあるかを答えよ。軸の上にある場合は、どの軸かを答えよ。
For each of the following exercises, construct a table and graph the equation by plotting at least three points.
次の各問について、表を作り、少なくとも三点を打って方程式のグラフを描け。
Numeric数値の問題
For each of the following exercises, find and plot the x- and y-intercepts, and graph the straight line based on those two points.
次の各問について、x切片と y切片を求めて打ち、その二点をもとに直線のグラフを描け。
For each of the following exercises, use the graph in the figure below.
次の各問では、下の図のグラフを使え。
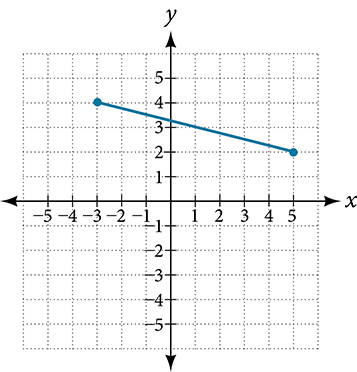
44. Find the coordinates of the midpoint of the line segment connecting the two points.
44. 二点を結ぶ線分の中点の座標を求めよ。
46. Find the distance that is from the origin. Round to three decimal places.
46. が原点からどれだけ離れているかを求めよ。小数第三位まで四捨五入せよ。
Technology機器を使う問題
For the following exercises, use your graphing calculator to input the linear graphs in the Y= graph menu.
次の各問では、グラフ電卓の Y= のメニューに一次関数のグラフを入力せよ。
After graphing it, use the 2nd CALC button and 1:value button, hit enter. At the lower part of the screen you will see “x=” and a blinking cursor. You may enter any number for x and it will display the y value for any x value you input. Use this and plug in x = 0, thus finding the y-intercept, for each of the following graphs.
グラフを描いたら、2nd CALC を押し、1:value を選んで ENTER を押す。画面の下に「x=」と点滅する印が出る。x に好きな数を入れると、その x に対する y の値が表示される。これを使って x = 0 を入れ、次の各グラフの y切片を求めよ。
For the following exercises, use your graphing calculator to input the linear graphs in the Y= graph menu.
次の各問では、グラフ電卓の Y= のメニューに一次関数のグラフを入力せよ。
After graphing it, use the 2nd CALC button and 2:zero button, hit ENTER. At the lower part of the screen you will see “left bound?” and a blinking cursor on the graph of the line. Move this cursor to the left of the x-intercept, hit ENTER. Now it says “right bound?” Move the cursor to the right of the x-intercept, hit ENTER. Now it says “guess?” Move your cursor to the left somewhere in between the left and right bound near the x-intercept. Hit ENTER. At the bottom of your screen it will display the coordinates of the x-intercept or the “zero” to the y-value. Use this to find the x-intercept.
グラフを描いたら、2nd CALC を押し、2:zero を選んで ENTER を押す。画面の下に「left bound?」と出て、直線のグラフの上で印が点滅する。この印を x切片の左へ動かして ENTER を押す。次に「right bound?」と出るので、印を x切片の右へ動かして ENTER を押す。次に「guess?」と出るので、印を左右の境のあいだ、x切片の近くへ動かす。ENTER を押す。画面の下に x切片の座標、すなわち y の値が0になる「零点」が表示される。これを使って x切片を求めよ。
Note: With linear/straight line functions the zero is not really a “guess,” but it is necessary to enter a “guess” so it will search and find the exact x-intercept between your right and left boundaries. With other types of functions (more than one x-intercept), they may be irrational numbers so “guess” is more appropriate to give it the correct limits to find a very close approximation between the left and right boundaries.
注意: 一次関数や直線では零点は本当の意味での「見当」ではないが、左右の境のあいだで正確な x切片を探させるために「見当」を入れる必要がある。ほかの型の関数(x切片が二つ以上あるもの)では、零点が無理数になることもあるので、左右の境のあいだできわめて近い近似値を求めさせるための正しい範囲を与えるという意味で、「見当」という言い方の方がふさわしい。
Extensions発展問題
54. Someone drove 10 mi directly east from their home, made a left turn at an intersection, and then traveled 5 mi north to their place of work. If a road was made directly from the home to the place of work, what would its distance be to the nearest tenth of a mile?
54. ある人が家からまっすぐ東へ10マイル走り、交差点で左に曲がって、北へ5マイル走って職場に着いた。家から職場までまっすぐ道を通したとすると、その長さは何マイルか。小数第一位まで求めよ。
56. Given these four points: , , , and find the coordinates of the midpoint of line segments and
56. 四つの点 、、、 が与えられている。線分 と の中点の座標を求めよ。
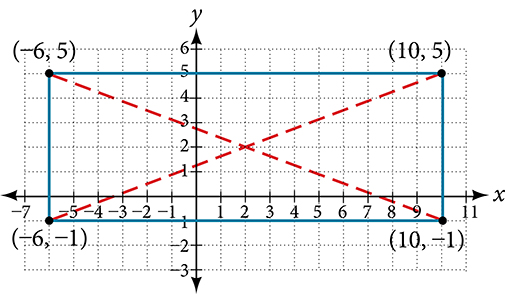
58. Given the graph of the rectangle shown and the coordinates of its vertices, prove that the diagonals of the rectangle are of equal length.
58. 示された長方形のグラフと、その頂点の座標が与えられている。長方形の対角線の長さが等しいことを証明せよ。
Real-World Applications応用問題
60. The coordinates on a map for San Francisco are and those for Sacramento are . Note that coordinates represent miles. Find the distance between the cities to the nearest mile.
60. 地図上の San Francisco の座標は 、Sacramento の座標は である。座標はマイルを表すことに注意せよ。二つの都市のあいだの距離を、1マイル単位で求めよ。
62. A small craft in Lake Ontario sends out a distress signal. The coordinates of the boat in trouble were One rescue boat is at the coordinates and a second Coast Guard craft is at coordinates . Assuming both rescue craft travel at the same rate, which one would get to the distressed boat the fastest?
62. オンタリオ湖の小型船が救難信号を出した。遭難した船の座標は だった。救助船の一隻は座標 に、もう一隻の沿岸警備隊の船は座標 にいる。両方の救助船が同じ速さで進むとすると、遭難した船に早く着くのはどちらか。
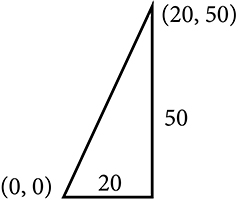
63. A person on the top of a building wants to have a guy wire extend to a point on the ground 20 ft from the building. To the nearest foot, how long will the wire have to be if the building is 50 ft tall?
63. 建物の屋上にいる人が、建物から20フィート離れた地面の一点まで支索を張りたい。建物の高さが50フィートのとき、支索の長さは何フィート必要か。1フィート単位で求めよ。
64. If we rent a truck and pay a $75/day fee plus $.20 for every mile we travel, write a linear equation that would express the total cost per day using to represent the number of miles we travel. Graph this function on your graphing calculator and find the total cost for one day if we travel 70 mi.
64. トラックを借りると1日75ドルの料金に加えて、走った1マイルごとに0.20ドルかかる。走るマイル数を として、1日あたりの費用の合計 を表す一次方程式を書け。この関数をグラフ電卓でグラフに描き、70マイル走ったときの1日の費用の合計を求めよ。