プリンピキア

第12章解析幾何Analytic Geometry

Answer Key解答
Solution 1解答 1

x 2 +y 2 16 =1

Solution 2解答 2

( x1 ) 2 16 +( y3 ) 2 4 =1

Solution 3解答 3

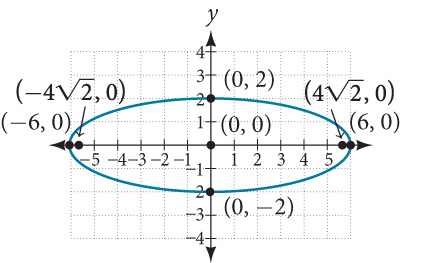
center: ( 0,0 ); vertices: ( ±6,0 ); co-vertices: ( 0,±2 ); foci: ( ±42 ,0 )

中心: ( 0,0 ); 頂点: ( ±6,0 ); 余頂点: ( 0,±2 ); 焦点: ( ±42 ,0 )

A Cartesian coordinate system shows an ellipse centered at the origin (0,0). The major axis is horizontal, with vertices at (-6, 0) and (6, 0). The minor axis is vertical, with y-intercepts at (0, 2) and (0, -2). The foci of the ellipse are located at (-4√2, 0) and (4√2, 0).

Solution 4解答 4

Standard form: x 2 16 +y 2 49 =1; center: ( 0,0 ); vertices: ( 0,±7 ); co-vertices: ( ±4,0 ); foci: ( 0,±33 )

標準の形: x 2 16 +y 2 49 =1; 中心: ( 0,0 ); 頂点: ( 0,±7 ); 余頂点: ( ±4,0 ); 焦点: ( 0,±33 )

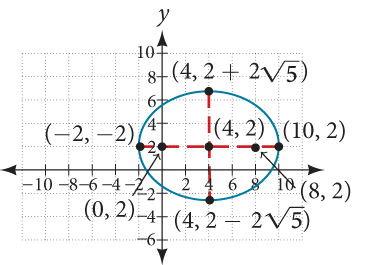
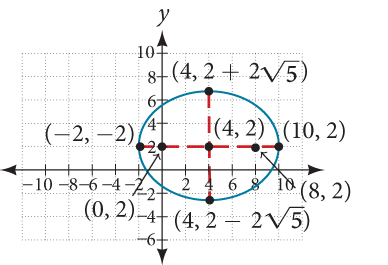
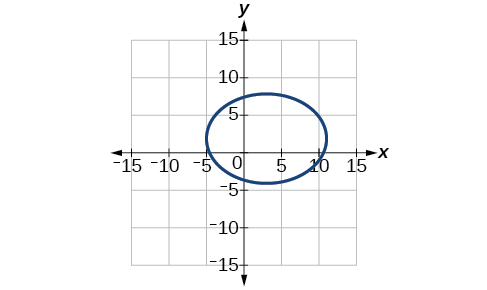
A coordinate plane shows an ellipse centered at (4, 2). Its major axis extends horizontally from (-2, 2) to (10, 2), and its minor axis extends vertically from (4, 2 - 2sqrt(5)) to (4, 2 + 2sqrt(5)).

Solution 5解答 5

Center: ( 4,2 ); vertices: ( 2,2 ) and ( 10,2 ); co-vertices: ( 4,225 ) and ( 4,2+25 ); foci: ( 0,2 ) and ( 8,2 )

中心: ( 4,2 ); 頂点: ( 2,2 )( 10,2 ); 余頂点: ( 4,225 )( 4,2+25 ); 焦点: ( 0,2 )( 8,2 )

A graph of an ellipse centered at (4, 2) on a Cartesian coordinate system. The horizontal major axis extends from (-2, 2) to (10, 2), and the vertical minor axis from (4, 2 - 2
5) to (4, 2 + 2
5). Foci are at (0, 2) and (8, 2).

Solution 6解答 6

(x3) 2 4 +( y+1 ) 2 16 =1; center: ( 3,1 ); vertices: ( 3,5 ) and ( 3,3 ); co-vertices: ( 1,1 ) and ( 5,1 ); foci: ( 3,123 ) and ( 3,1+23 )

(x3) 2 4 +( y+1 ) 2 16 =1; 中心: ( 3,1 ); 頂点: ( 3,5 )( 3,3 ); 余頂点: ( 1,1 )( 5,1 ); 焦点: ( 3,123 )( 3,1+23 )

Solution 7解答 7

x 2 57,600 +y 2 25,600 =1The people are standing 358 feet apart.

この二人は358フィート離れて立っている。

Solution 1解答 1

Vertices: ( ±3,0 ); Foci: ( ±34 ,0 )

頂点: ( ±3,0 ); 焦点: ( ±34 ,0 )

Solution 2解答 2

y 2 4 x 2 16 =1

Solution 3解答 3

( y3 ) 2 25 -( x1 ) 2 144 =1

Solution 4解答 4

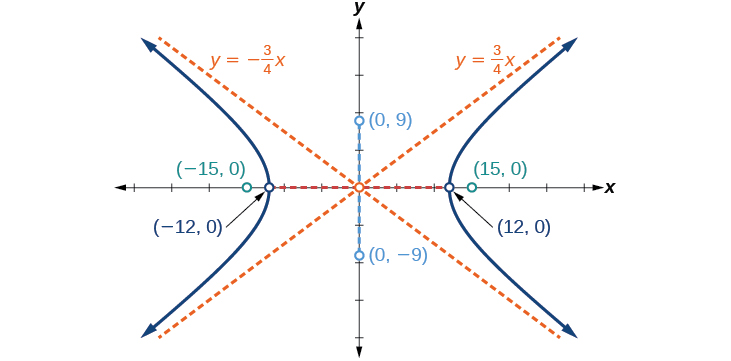
vertices: ( ±12,0 ); co-vertices: ( 0,±9 ); foci: ( ±15,0 ); asymptotes: y=±3 4 x;

頂点: ( ±12,0 ); 余頂点: ( 0,±9 ); 焦点: ( ±15,0 ); 漸近線: y=±3 4 x;

A hyperbola centered at the origin with vertices (±12, 0), foci (±15, 0), and asymptotes y = ±(3/4)x. Points (0, ±9) are on the conjugate axis.

Solution 5解答 5

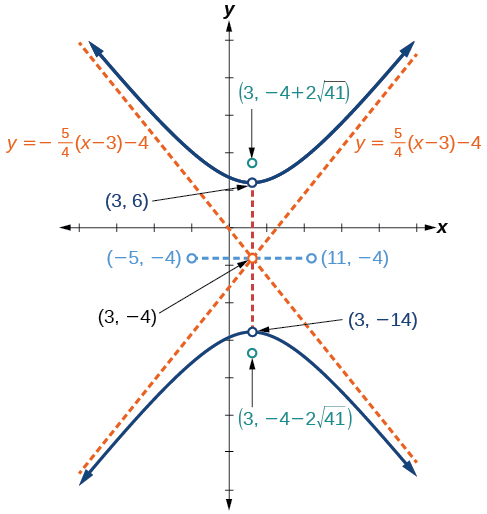
center: ( 3,4 ); vertices: ( 3,14 ) and ( 3,6 ); co-vertices: ( 5,4 ); and ( 11,4 ); foci: ( 3,4241 ) and ( 3,4+241 ); asymptotes: y=±5 4 ( x3 )4

中心: ( 3,4 ); 頂点: ( 3,14 )( 3,6 ); 余頂点: ( 5,4 );( 11,4 ); 焦点: ( 3,4241 )( 3,4+241 ); 漸近線: y=±5 4 ( x3 )4

A graph depicts a hyperbola opening along the y-axis, centered at the point (3, -4). The upper branch has a vertex at (3, 6) and a focus at (3, -4 + 2 sqrt(41)). The lower branch has a vertex at (3, -14) and a focus at (3, -4 - 2 sqrt(41)). The asymptotes are represented by dashed orange lines with equations y = (5/4)(x-3)-4 and y = -(5/4)(x-3)-4. A horizontal dashed blue line passes through the center at y = -4, with points (-5, -4) and (11, -4) marked on it. A vertical dashed red line passes through the center at x = 3, intersecting the vertices and foci.

Solution 6解答 6

The sides of the tower can be modeled by the hyperbolic equation. x 2 400 y 2 3600 =1or x 2 20 2 y 2 60 2 =1.

この塔の側面は双曲線の式でモデルにできる。x 2 400 y 2 3600 =1またはx 2 20 2 y 2 60 2 =1.

Solution 1解答 1

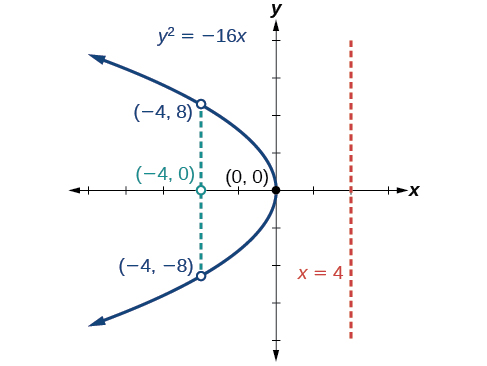
Focus: ( 4,0 ); Directrix: x=4; Endpoints of the latus rectum: ( 4,±8 )

焦点: ( 4,0 ); 準線: x=4; 通径の端点: ( 4,±8 )

A graph displays the parabola y^2 = -16x. Its vertex is at (0, 0), the focus at (-4, 0), and the directrix is the line x = 4. Points (-4, 8) and (-4, -8) are shown on the parabola.

Solution 2解答 2

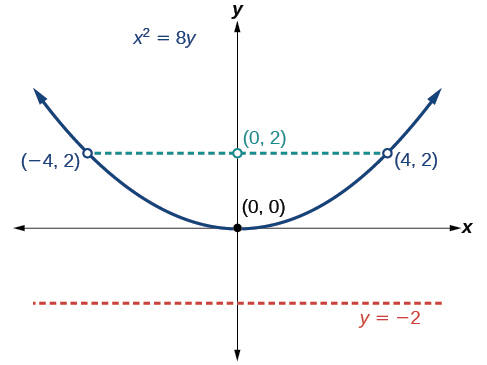
Focus: ( 0,2 ); Directrix: y=−2; Endpoints of the latus rectum: ( ±4,2 ).

焦点: ( 0,2 ); 準線: y=−2; 通径の端点: ( ±4,2 )

The graph of the parabola x^2=8y, centered at the origin (0,0), with its focus at (0,2) and directrix at y=-2. The points (-4,2) and (4,2) on the parabola are also indicated.

Solution 3解答 3

x 2 =14y.

Solution 4解答 4

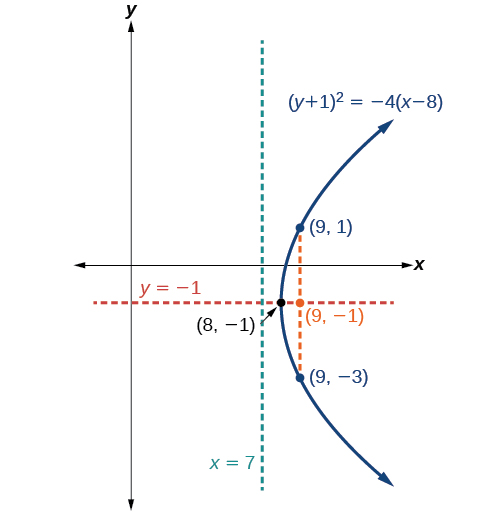
Vertex: ( 8,1 ); Axis of symmetry: y=−1; Focus: ( 9,1 ); Directrix: x=7; Endpoints of the latus rectum: ( 9,3 ) and ( 9,1 ).

頂点: ( 8,1 ); 対称軸: y=−1; 焦点: ( 9,1 ); 準線: x=7; 通径の端点: ( 9,3 )( 9,1 )

Graph of the parabola (y+1)^2 = -4(x-8) opening left. Vertex (8, -1), focus (9, -1), and directrix x=7 are labeled, along with points (9, 1) and (9, -3) on the curve.

Solution 5解答 5

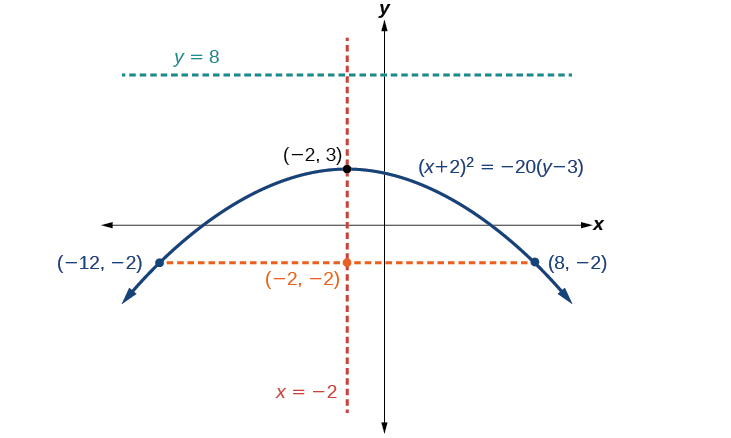
Vertex: ( 2,3 ); Axis of symmetry: x=−2; Focus: ( 2,2 ); Directrix: y=8; Endpoints of the latus rectum: ( 12,2 ) and ( 8,2 ).

頂点: ( 2,3 ); 対称軸: x=−2; 焦点: ( 2,2 ); 準線: y=8; 通径の端点: ( 12,2 )( 8,2 )

A graph of a downward-opening parabola with equation (x+2)^2 = -20(y-3). Its vertex is at (-2, 3), axis of symmetry x = -2, focus at (-2, -2), and directrix y = 8.

Solution 6解答 6

y 2 =1280xThe depth of the cooker is 500 mm

この調理器の深さは500mmである

Solution 1解答 1

hyperbolaellipse

双曲線楕円

Solution 2解答 2

x 2 4 +y 2 1 =1

Solution 3解答 3

hyperbolaellipse

双曲線楕円

Solution 1解答 1

ellipse; e=1 3 ;x=2

楕円。e=1 3 ;x=2

Solution 2解答 2

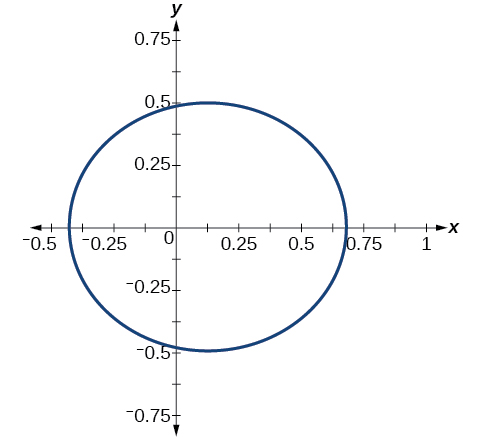
A two-dimensional Cartesian coordinate system displays a dark blue circle. The x-axis is labeled 'x' and ranges from -0.5 to 1, with tick marks every 0.25. The y-axis is labeled 'y' and ranges from -0.75 to 0.75, with tick marks every 0.25. The circle is centered at (0.25, 0) and has a radius of 0.5, extending from x = -0.25 to x = 0.75 and from y = -0.5 to y = 0.5.

Solution 3解答 3

r=1 1cosθ

Solution 4解答 4

48x+3x 2 y 2 =0

12.1 Section Exercises12.1 節末問題

Solution 1解答 1

An ellipse is the set of all points in the plane the sum of whose distances from two fixed points, called the foci, is a constant.

楕円とは、平面上の点のうち、焦点という二つの定まった点からの距離の和が一定であるものすべての集合である。
Solution 3解答 3

This special case would be a circle.

この特別な場合は円になる。

Solution 5解答 5

It is symmetric about the x-axis, y-axis, and the origin.

x軸、y軸、原点について対称である。

Solution 7解答 7

yes; x 2 3 2 +y 2 2 2 =1

そうである。x 2 3 2 +y 2 2 2 =1

Solution 9解答 9

yes; x 2 ( 1 2 ) 2 +y 2 ( 1 3 ) 2 =1

そうである。x 2 ( 1 2 ) 2 +y 2 ( 1 3 ) 2 =1

Solution 11解答 11

x 2 2 2 +y 2 7 2 =1; Endpoints of major axis ( 0,7 ) and ( 0,7 ). Endpoints of minor axis ( 2,0 ) and ( 2,0 ). Foci at ( 0,35 ),( 0,35 ).

x 2 2 2 +y 2 7 2 =1; 長軸の端点 ( 0,7 )( 0,7 ) 短軸の端点 ( 2,0 )( 2,0 ) 焦点 ( 0,35 ),( 0,35 )

Solution 13解答 13

x 2 ( 1 ) 2 +y 2 ( 1 3 ) 2 =1; Endpoints of major axis ( 1,0 ) and ( 1,0 ). Endpoints of minor axis ( 0,1 3 ),( 0,1 3 ). Foci at ( 22 3 ,0 ),( 22 3 ,0 ).

x 2 ( 1 ) 2 +y 2 ( 1 3 ) 2 =1; 長軸の端点 ( 1,0 )( 1,0 ) 短軸の端点 ( 0,1 3 ),( 0,1 3 ) 焦点 ( 22 3 ,0 ),( 22 3 ,0 )

Solution 15解答 15

( x2 ) 2 7 2 +( y4 ) 2 5 2 =1; Endpoints of major axis ( 9,4 ),( 5,4 ). Endpoints of minor axis ( 2,9 ),( 2,1 ). Foci at ( 2+26 ,4 ),( 226 ,4 ).

( x2 ) 2 7 2 +( y4 ) 2 5 2 =1; 長軸の端点 ( 9,4 ),( 5,4 ) 短軸の端点 ( 2,9 ),( 2,1 ) 焦点 ( 2+26 ,4 ),( 226 ,4 )

Solution 17解答 17

( x+5 ) 2 2 2 +( y7 ) 2 3 2 =1; Endpoints of major axis ( 5,10 ),( 5,4 ). Endpoints of minor axis ( 3,7 ),( 7,7 ). Foci at ( 5,7+5 ),( 5,75 ).

( x+5 ) 2 2 2 +( y7 ) 2 3 2 =1; 長軸の端点 ( 5,10 ),( 5,4 ) 短軸の端点 ( 3,7 ),( 7,7 ) 焦点 ( 5,7+5 ),( 5,75 )

Solution 19解答 19

( x1 ) 2 3 2 +( y4 ) 2 2 2 =1; Endpoints of major axis ( 4,4 ),( 2,4 ). Endpoints of minor axis ( 1,6 ),( 1,2 ). Foci at ( 1+5 ,4 ),( 15 ,4 ).

( x1 ) 2 3 2 +( y4 ) 2 2 2 =1; 長軸の端点 ( 4,4 ),( 2,4 ) 短軸の端点 ( 1,6 ),( 1,2 ) 焦点 ( 1+5 ,4 ),( 15 ,4 )

Solution 21解答 21

( x3 ) 2 ( 32 ) 2 +( y5 ) 2 ( 2 ) 2 =1; Endpoints of major axis ( 3+32 ,5 ),( 332 ,5 ). Endpoints of minor axis ( 3,5+2 ),( 3,52 ). Foci at ( 7,5 ),( 1,5 ).

( x3 ) 2 ( 32 ) 2 +( y5 ) 2 ( 2 ) 2 =1; 長軸の端点 ( 3+32 ,5 ),( 332 ,5 ) 短軸の端点 ( 3,5+2 ),( 3,52 ) 焦点 ( 7,5 ),( 1,5 )

Solution 23解答 23

( x+5 ) 2 ( 5 ) 2 +( y2 ) 2 ( 2 ) 2 =1; Endpoints of major axis ( 0,2 ),( 10,2 ). Endpoints of minor axis ( 5,4 ),( 5,0 ). Foci at ( 5+21 ,2 ),( 521 ,2 ).

( x+5 ) 2 ( 5 ) 2 +( y2 ) 2 ( 2 ) 2 =1; 長軸の端点 ( 0,2 ),( 10,2 ) 短軸の端点 ( 5,4 ),( 5,0 ) 焦点 ( 5+21 ,2 ),( 521 ,2 )

Solution 25解答 25

( x+3 ) 2 ( 5 ) 2 +( y+4 ) 2 ( 2 ) 2 =1; Endpoints of major axis ( 2,4 ),( 8,4 ). Endpoints of minor axis ( 3,2 ),( 3,6 ). Foci at ( 3+21 ,4 ),( 321 ,4 ).

( x+3 ) 2 ( 5 ) 2 +( y+4 ) 2 ( 2 ) 2 =1; 長軸の端点 ( 2,4 ),( 8,4 ) 短軸の端点 ( 3,2 ),( 3,6 ) 焦点 ( 3+21 ,4 ),( 321 ,4 )

Solution 27解答 27

Foci ( 3,1+11 ),( 3,111 )

焦点 ( 3,1+11 ),( 3,111 )

Solution 29解答 29

Focus ( 0,0 )

焦点 ( 0,0 )

Solution 31解答 31

Foci ( 10,30 ),( 10,30 )

焦点 ( 10,30 ),( 10,30 )

Solution 33解答 33

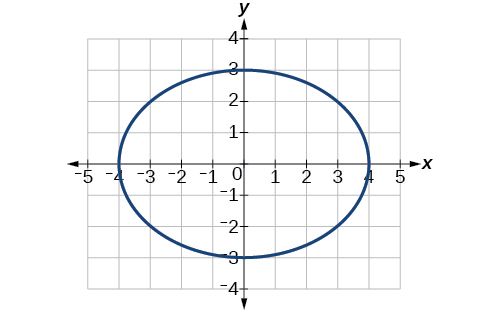
Center ( 0,0 ), Vertices ( 4,0 ),( 4,0 ),(0,3),(0,3), Foci ( 7 ,0 ),( 7 ,0 )

中心 ( 0,0 ) 頂点 ( 4,0 ),( 4,0 ),(0,3),(0,3) 焦点 ( 7 ,0 ),( 7 ,0 )

A Cartesian coordinate system displays an ellipse centered at the origin, with x-axis extending from -4 to 4 and y-axis from -3 to 3.

Solution 35解答 35

Center ( 0,0 ), Vertices ( 1 9 ,0 ),( 1 9 ,0 ),( 0,1 7 ),( 0,1 7 ), Foci ( 0,42 63 ),( 0,42 63 )

中心 ( 0,0 ) 頂点 ( 1 9 ,0 ),( 1 9 ,0 ),( 0,1 7 ),( 0,1 7 ) 焦点 ( 0,42 63 ),( 0,42 63 )

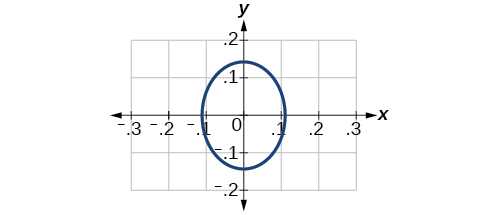
A graph shows an upright ellipse centered at the origin. The x-axis spans from -0.3 to 0.3, and the y-axis from -0.2 to 0.2. The ellipse's approximate x-intercepts are +/- 0.1 and y-intercepts are +/- 0.15.

Solution 37解答 37

Center ( 3,3 ), Vertices ( 0,3 ),( 6,3 ),( 3,0 ),( 3,6 ), Focus ( 3,3 )

中心 ( 3,3 ) 頂点 ( 0,3 ),( 6,3 ),( 3,0 ),( 3,6 ) 焦点 ( 3,3 )

Note that this ellipse is a circle. The circle has only one focus, which coincides with the center.

この楕円は円であることに注意せよ。円は焦点を一つしか持たず、それは中心と一致する。
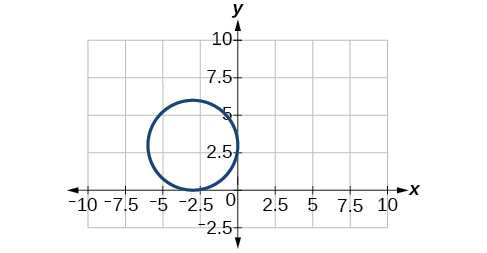
A blue circle is plotted on a Cartesian coordinate system. The x-axis ranges from -10 to 10, and the y-axis from -2.5 to 10. The circle is centered at (-2.5, 2.5) with a radius of 2.5 units.

Solution 39解答 39

Center ( 1,1 ), Vertices ( 5,1 ),( 3,1 ),( 1,3 ),( 1,1 ), Foci (1+23,1), (1-23,1)

中心 ( 1,1 ) 頂点 ( 5,1 ),( 3,1 ),( 1,3 ),( 1,1 ) 焦点 (1+23,1), (1-23,1)

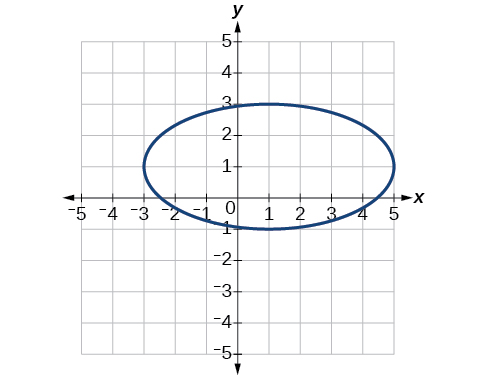
An ellipse is displayed on a Cartesian coordinate plane with x and y axes ranging from -5 to 5. The ellipse is horizontally elongated, centered at (1,1).

Solution 41解答 41

Center ( 4,5 ), Vertices ( 2,5 ),( 6,5 ),( 4,6 ),( 4,4 ), Foci ( 4+3 ,5 ),( 43 ,5 )

中心 ( 4,5 ) 頂点 ( 2,5 ),( 6,5 ),( 4,6 ),( 4,4 ) 焦点 ( 4+3 ,5 ),( 43 ,5 )

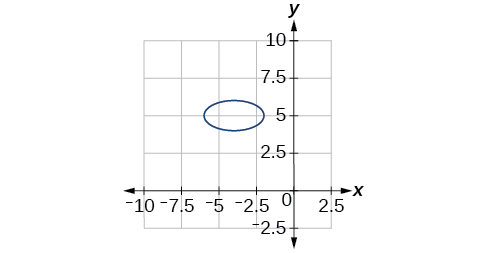
An ellipse is plotted on a Cartesian coordinate system. The x-axis ranges from -10 to 2.5, with major ticks at -10, -7.5, -5, -2.5, 0, and 2.5. The y-axis ranges from -2.5 to 10, with major ticks at -2.5, 0, 2.5, 5, 7.5, and 10. The ellipse is centered approximately at (-4, 5) and is horizontally elongated, extending from about x=-6 to x=-2.5 and vertically from about y=4 to y=6.

Solution 43解答 43

Center ( 2,1 ), Vertices ( 0,1 ),( 4,1 ),( 2,5 ),( 2,3 ), Foci ( 2,1+23 ),( 2,123 )

中心 ( 2,1 ) 頂点 ( 0,1 ),( 4,1 ),( 2,5 ),( 2,3 ) 焦点 ( 2,1+23 ),( 2,123 )

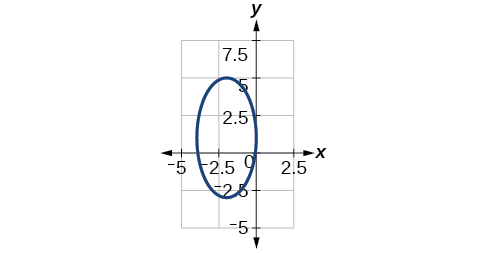
A graph displays a blue, vertically oriented ellipse centered around (-1, 2) on a Cartesian coordinate plane. The x-axis ranges from -5 to 2.5, and the y-axis from -5 to 7.5.

Solution 45解答 45

Center ( 2,2 ), Vertices ( 0,2 ),( 4,2 ),( 2,0 ),( 2,4 ), Focus ( 2,2 )

中心 ( 2,2 ) 頂点 ( 0,2 ),( 4,2 ),( 2,0 ),( 2,4 ) 焦点 ( 2,2 )

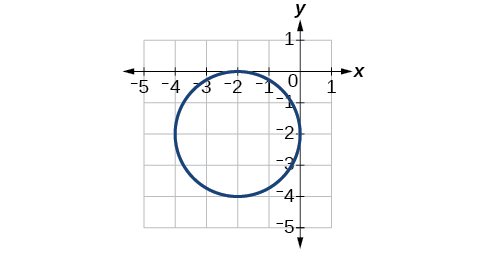
A graph displays a circle on a coordinate plane. The circle is centered at (-2, -2) and has a radius of 2, passing through points such as (-4, -2), (0, -2), (-2, 0), and (-2, -4).

Solution 47解答 47

x 2 25 +y 2 29 =1

Solution 49解答 49

( x4 ) 2 25 +( y2 ) 2 1 =1

Solution 51解答 51

( x+3 ) 2 16 +( y4 ) 2 4 =1

Solution 53解答 53

x 2 81 +y 2 9 =1

Solution 55解答 55

( x+2 ) 2 4 +( y2 ) 2 9 =1

Solution 57解答 57

Area = 12πsquareunits

Solution 59解答 59

Area = 25 π square units.

Area = 25 π 平方単位。

Solution 61解答 61

Area = 9π square units.

Area = 9π 平方単位。

Solution 63解答 63

x 2 4h 2 +y 2 1 4 h 2 =1

Solution 65解答 65

x 2 400 +y 2 144 =1 . Distance = 17.32 feet

x 2 400 +y 2 144 =1。距離 = 17.32フィート

Solution 67解答 67

Approximately 51.96 feet

およそ51.96フィート

12.2 Section Exercises12.2 節末問題

Solution 1解答 1

A hyperbola is the set of points in a plane the difference of whose distances from two fixed points (foci) is a positive constant.

双曲線とは、平面上の点のうち、二つの定まった点(焦点)からの距離の差が正の定数であるものの集合である。

Solution 3解答 3

The foci must lie on the transverse axis and be in the interior of the hyperbola.

焦点は主軸上にあり、双曲線の内側になければならない。

Solution 5解答 5

The center must be the midpoint of the line segment joining the foci.

中心は、焦点を結ぶ線分の中点でなければならない。
Solution 7解答 7

yes x 2 6 2 y 2 3 2 =1

そうである x 2 6 2 y 2 3 2 =1

Solution 9解答 9

yes x 2 4 2 y 2 5 2 =1

そうである x 2 4 2 y 2 5 2 =1

Solution 11解答 11

x 2 5 2 y 2 6 2 =1; vertices: ( 5,0 ),( 5,0 ); foci: ( 61 ,0 ),( 61 ,0 ); asymptotes: y=6 5 x,y=6 5 x

x 2 5 2 y 2 6 2 =1; 頂点: ( 5,0 ),( 5,0 ); 焦点: ( 61 ,0 ),( 61 ,0 ); 漸近線: y=6 5 x,y=6 5 x

Solution 13解答 13

y 2 2 2 x 2 9 2 =1; vertices: ( 0,2 ),( 0,2 ); foci: ( 0,85 ),( 0,85 ); asymptotes: y=2 9 x,y=2 9 x

y 2 2 2 x 2 9 2 =1; 頂点: ( 0,2 ),( 0,2 ); 焦点: ( 0,85 ),( 0,85 ); 漸近線: y=2 9 x,y=2 9 x

Solution 15解答 15

( x1 ) 2 3 2 ( y2 ) 2 4 2 =1; vertices: ( 4,2 ),( 2,2 ); foci: ( 6,2 ),( 4,2 ); asymptotes: y=4 3 ( x1 )+2,y=4 3 ( x1 )+2

( x1 ) 2 3 2 ( y2 ) 2 4 2 =1; 頂点: ( 4,2 ),( 2,2 ); 焦点: ( 6,2 ),( 4,2 ); 漸近線: y=4 3 ( x1 )+2,y=4 3 ( x1 )+2

Solution 17解答 17

( x2 ) 2 7 2 ( y+7 ) 2 7 2 =1; vertices: ( 9,7 ),( 5,7 ); foci: ( 2+72 ,7 ),( 272 ,7 ); asymptotes: y=x9,y=x5

( x2 ) 2 7 2 ( y+7 ) 2 7 2 =1; 頂点: ( 9,7 ),( 5,7 ); 焦点: ( 2+72 ,7 ),( 272 ,7 ); 漸近線: y=x9,y=x5

Solution 19解答 19

( x+3 ) 2 3 2 ( y3 ) 2 3 2 =1; vertices: ( 0,3 ),( 6,3 ); foci: ( 3+32 ,1 ),( 332 ,1 ); asymptotes: y=x+6,y=x

( x+3 ) 2 3 2 ( y3 ) 2 3 2 =1; 頂点: ( 0,3 ),( 6,3 ); 焦点: ( 3+32 ,1 ),( 332 ,1 ); 漸近線: y=x+6,y=x

Solution 21解答 21

( y4 ) 2 2 2 ( x3 ) 2 4 2 =1; vertices: ( 3,6 ),( 3,2 ); foci: ( 3,4+25 ),( 3,425 ); asymptotes: y=1 2 ( x3 )+4,y=1 2 ( x3 )+4

( y4 ) 2 2 2 ( x3 ) 2 4 2 =1; 頂点: ( 3,6 ),( 3,2 ); 焦点: ( 3,4+25 ),( 3,425 ); 漸近線: y=1 2 ( x3 )+4,y=1 2 ( x3 )+4

Solution 23解答 23

( y+5 ) 2 7 2 ( x+1 ) 2 70 2 =1; vertices: ( 1,2 ),( 1,12 ); foci: ( 1,5+7101 ),( 1,57101 ); asymptotes: y=1 10 ( x+1 )5,y=1 10 ( x+1 )5

( y+5 ) 2 7 2 ( x+1 ) 2 70 2 =1; 頂点: ( 1,2 ),( 1,12 ); 焦点: ( 1,5+7101 ),( 1,57101 ); 漸近線: y=1 10 ( x+1 )5,y=1 10 ( x+1 )5

Solution 25解答 25

( x+3 ) 2 5 2 ( y4 ) 2 2 2 =1; vertices: ( 2,4 ),( 8,4 ); foci: ( 3+29 ,4 ),( 329 ,4 ); asymptotes: y=2 5 ( x+3 )+4,y=2 5 ( x+3 )+4

( x+3 ) 2 5 2 ( y4 ) 2 2 2 =1; 頂点: ( 2,4 ),( 8,4 ); 焦点: ( 3+29 ,4 ),( 329 ,4 ); 漸近線: y=2 5 ( x+3 )+4,y=2 5 ( x+3 )+4

Solution 27解答 27

y=2 5 ( x3 )4,y=2 5 ( x3 )4

Solution 29解答 29

y=3 4 ( x1 )+1,y=3 4 ( x1 )+1

Solution 31解答 31

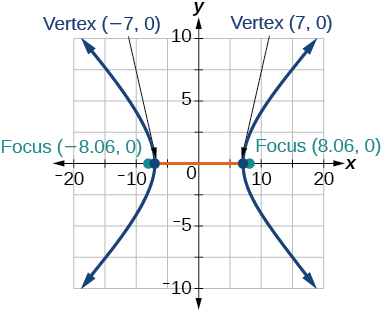
The image shows a hyperbola centered at the origin, opening to the left and right. Its vertices are labeled at (-7,0) and (7,0), while its foci are labeled at approximately (-8.06,0) and (8.06,0). The graph is set against a grid with x-axis values ranging from -20 to 20 and y-axis values from -10 to 10.

Solution 33解答 33

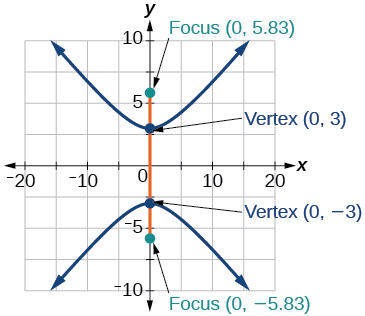
A graph shows a hyperbola centered at the origin. The transverse axis is along the y-axis. The vertices are labeled at (0, 3) and (0, -3). The foci are labeled at (0, 5.83) and (0, -5.83).

Solution 35解答 35

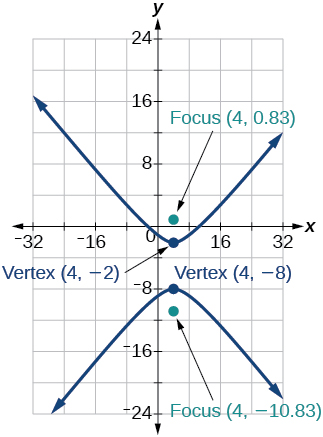
A graph of a vertically oriented hyperbola. Vertices are (4, -2) and (4, -8). Foci are (4, 0.83) and (4, -10.83).

Solution 37解答 37

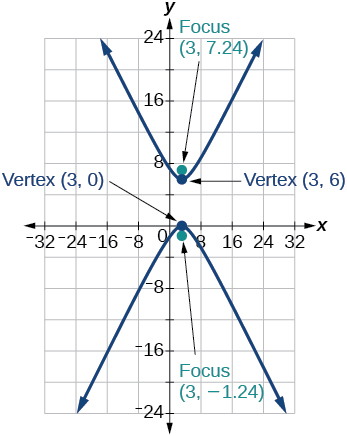
A hyperbola graph with vertices labeled at (3, 0) and (3, 6), and foci at (3, -1.24) and (3, 7.24). The branches open upwards and downwards along the y-axis.

Solution 39解答 39

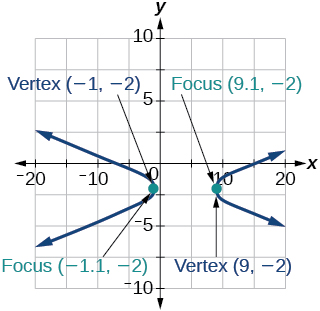
A graph on a coordinate plane shows a hyperbola with its center at (4, -2). The two vertices are labeled at (-1, -2) and (9, -2). The two foci are labeled at approximately (-1.1, -2) and (9.1, -2). The hyperbola opens horizontally, with its branches extending to the left from the vertex at (-1, -2) and to the right from the vertex at (9, -2). The x-axis ranges from -20 to 20, and the y-axis ranges from -10 to 10.

Solution 41解答 41

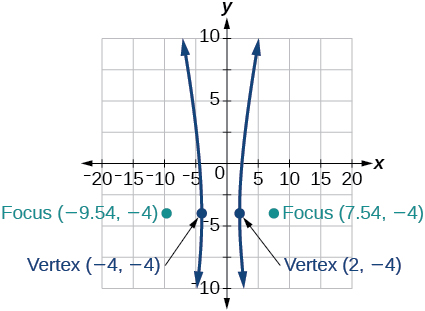
A graph shows a hyperbola on a coordinate plane. The x-axis ranges from -20 to 20 and the y-axis ranges from -10 to 10. The hyperbola has two branches opening horizontally, one to the left and one to the right. The left vertex is labeled as (-4, -4) and the right vertex is labeled as (2, -4). The left focus is labeled as (-9.54, -4) and the right focus is labeled as (7.54, -4).

Solution 43解答 43

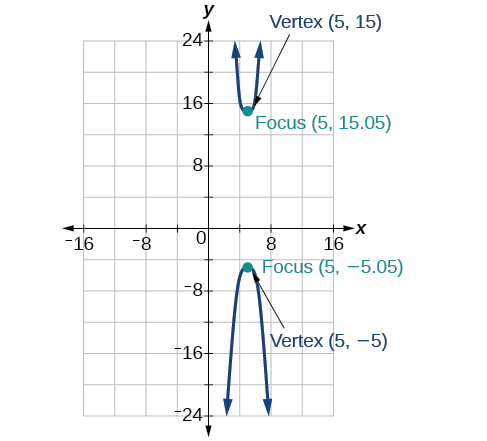
A Cartesian coordinate system displays two parabolas. The top parabola opens upwards, with its vertex marked at (5, 15) and its focus marked at (5, 15.05). The bottom parabola opens downwards, with its vertex marked at (5, -5) and its focus marked at (5, -5.05). Both parabolas share the vertical line x=5 as their axis of symmetry. The x-axis spans from -16 to 16, and the y-axis spans from -24 to 24.

Solution 45解答 45

x 2 9 y 2 16 =1

Solution 47解答 47

( x6 ) 2 25 ( y1 ) 2 11 =1

Solution 49解答 49

( x4 ) 2 25 ( y2 ) 2 1 =1

Solution 51解答 51

y 2 16 x 2 25 =1

Solution 53解答 53

y 2 9 ( x+1 ) 2 9 =1

Solution 55解答 55

( x+3 ) 2 25 ( y+3 ) 2 25 =1

Solution 57解答 57

y( x )=3x 2 +1 ,y( x )=3x 2 +1

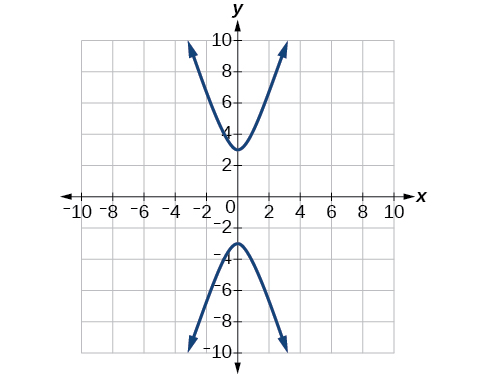
A graph showing two parabolas. The upper parabola opens upwards with its vertex at (0, 3), and the lower parabola opens downwards with its vertex at (0, -3). Both are symmetric about the y-axis.

Solution 59解答 59

y( x )=1+2x 2 +4x+5 ,y( x )=12x 2 +4x+5

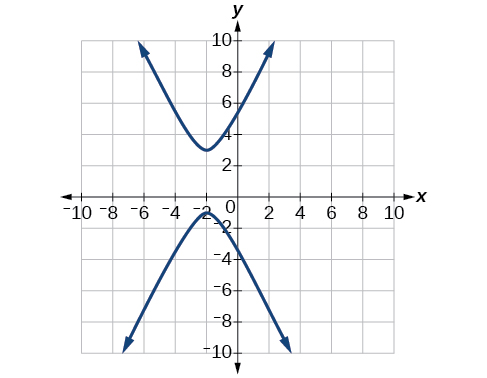
A graph on a Cartesian coordinate system with x- and y-axes ranging from -10 to 10. The graph displays two curves. The upper curve opens upwards, with its vertex at approximately (-2, 3), and extends to the upper left and upper right. The lower curve opens downwards, with its vertex at approximately (-2, -1), and extends to the lower left and lower right. Both curves appear to be parabolas, suggesting a conic section or a pair of quadratic functions.

Solution 61解答 61

x 2 25 y 2 25 =1

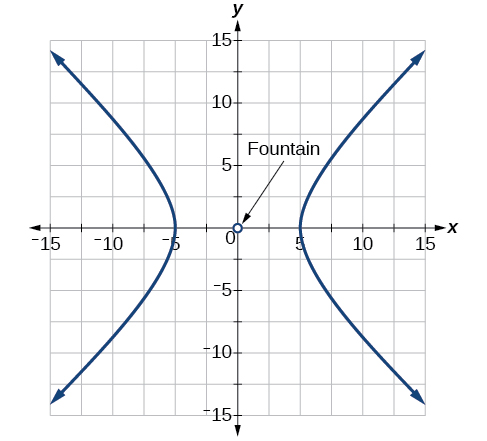
A Cartesian coordinate system with x and y axes ranging from -15 to 15. A hyperbola with horizontal branches is plotted, with its vertices at approximately x = -4 and x = 4. The origin (0,0) is marked with an open circle and labeled

Solution 63解答 63

x 2 100 y 2 25 =1

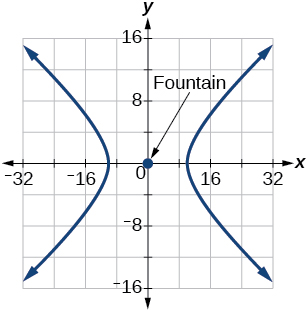
A graph displays a hyperbola centered at the origin, labeled

Solution 65解答 65

x 2 400 y 2 225 =1

A graph displays a hyperbola centered at the origin (0,0), labeled

Solution 67解答 67

4(x-1)2-y22=16

Solution 69解答 69

( xh ) 2 a2 - (y-k)2 b2 =(x-3)2-9y2=4

12.3 Section Exercises12.3 節末問題

Solution 1解答 1

A parabola is the set of points in the plane that lie equidistant from a fixed point, the focus, and a fixed line, the directrix.

放物線とは、平面上の点のうち、焦点という定まった点と、準線という定まった直線から等しい距離にあるものの集合である。
Solution 3解答 3

The graph will open down.

グラフは下に開く。

Solution 5解答 5

The distance between the focus and directrix will increase.

焦点と準線の距離は増す。

Solution 7解答 7

yes x2=4(116)y

そうである x2=4(116)y

Solution 9解答 9

yes ( y3 ) 2 =4(2)( x2 )

そうである ( y3 ) 2 =4(2)( x2 )

Solution 11解答 11

y 2 =1 8 x,V:(0,0);F:( 1 32 ,0 );d:x=1 32

Solution 13解答 13

x 2 =1 4 y,V:( 0,0 );F:( 0,1 16 );d:y=1 16

Solution 15解答 15

y 2 =1 36 x,V:( 0,0 );F:( 1 144 ,0 );d:x=1 144

Solution 17解答 17

( x1 ) 2 =4( y1 ),V:( 1,1 );F:( 1,2 );d:y=0

Solution 19解答 19

( y4 ) 2 =2( x+3 ),V:( 3,4 );F:( 5 2 ,4 );d:x=7 2

Solution 21解答 21

( x+4 ) 2 =24( y+1 ),V:( 4,1 );F:( 4,5 );d:y=−7

Solution 23解答 23

( y3 ) 2 =−12( x+1 ),V:( 1,3 );F:( 4,3 );d:x=2

Solution 25解答 25

( x5 ) 2 =4 5 ( y+3 ),V:( 5,3 );F:( 5,14 5 );d:y=16 5

Solution 27解答 27

( x2 ) 2 =−2( y5 ),V:( 2,5 );F:( 2,9 2 );d:y=11 2

Solution 29解答 29

( y1 ) 2 =4 3 ( x5 ),V:( 5,1 );F:( 16 3 ,1 );d:x=14 3

Solution 31解答 31

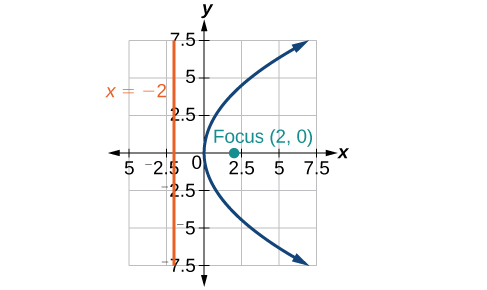
A graph of a parabola shown on a coordinate plane, with its focus at (2, 0) marked by a green dot and its directrix as the vertical orange line x = -2.

Solution 33解答 33

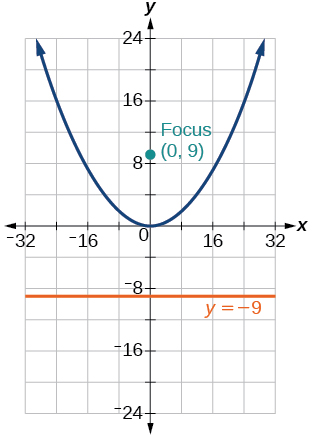
A graph showing a parabola opening upwards, with its vertex at the origin (0,0). The focus is located at (0,9) and labeled

Solution 35解答 35

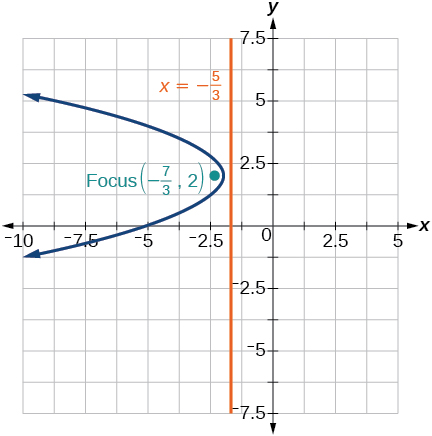
A graph displays a parabola opening to the left. The focus is marked at (-7/3, 2). The directrix is a vertical line at x = -5/3. The x-axis ranges from -10 to 5, and the y-axis ranges from -7.5 to 7.5.

Solution 37解答 37

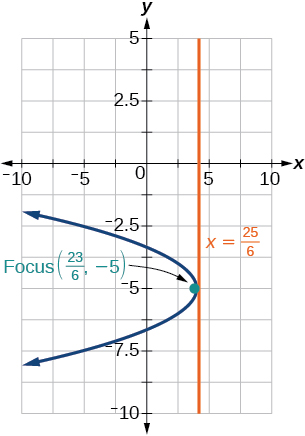
A parabola opening left is graphed with its focus at (23/6, -5) and its directrix as the vertical line x = 25/6, shown on a Cartesian coordinate plane.

Solution 39解答 39

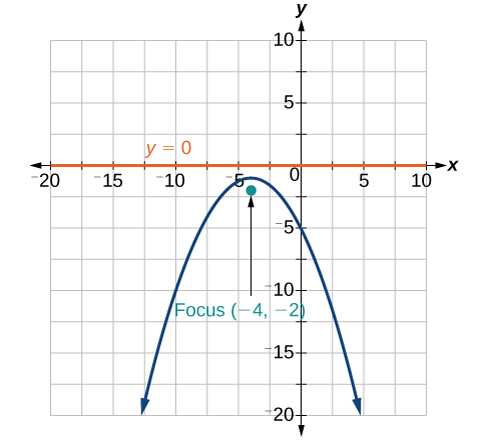
A Cartesian coordinate system shows a parabola opening downwards. The x-axis ranges from -20 to 10 and the y-axis from -20 to 10. The directrix of the parabola is indicated by an orange horizontal line labeled

Solution 41解答 41

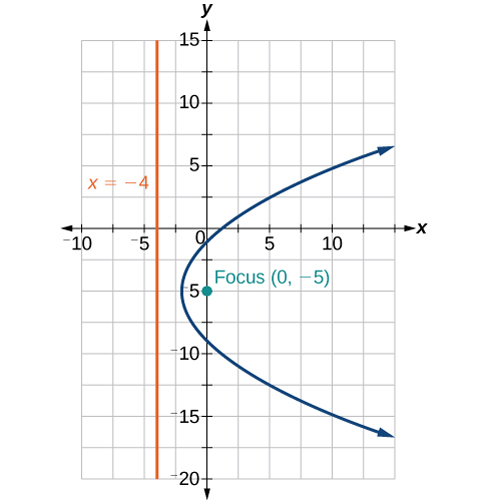
A graph of a parabola plotted on a coordinate plane. The x-axis ranges from -10 to 15, and the y-axis ranges from -20 to 15. A blue curve represents the parabola, which opens horizontally to the right. A green dot marks the focus of the parabola at the coordinates (0, -5). An orange vertical line, labeled

Solution 43解答 43

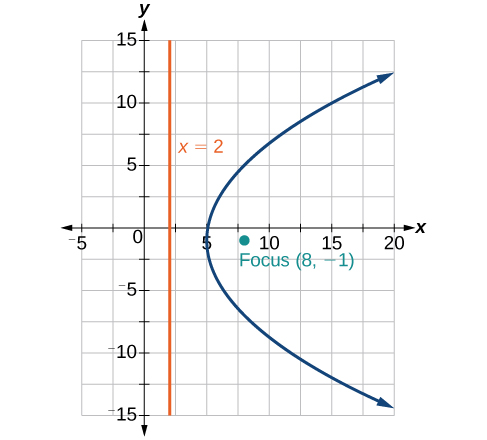
A graph displays a parabola opening to the right, with its directrix at x = 2 shown as a vertical orange line and its focus marked as a teal point at (8, -1).

Solution 45解答 45

x 2 =−16y

Solution 47解答 47

( y2 ) 2 =42 ( x2 )

Solution 49解答 49

( y+3 ) 2 =−42 ( x2 )

Solution 51解答 51

x 2 =y

Solution 53解答 53

( y2 ) 2 =1 4 ( x+2 )

Solution 55解答 55

( y3 ) 2 =45 ( x+2 )

Solution 57解答 57

y 2 =−8x

Solution 59解答 59

( y+1 ) 2 =12( x+3 )

Solution 61解答 61

( 0,1 )

Solution 63解答 63

At the point 2.25 feet above the vertex.

頂点の2.25フィート上の点。

Solution 65解答 65

0.5625 feet

0.5625フィート

Solution 67解答 67

x 2 =−125( y20 ), height is 7.2 feet

x 2 =−125( y20 ) 高さは7.2フィート

Solution 69解答 69

2304 feet

2304フィート

12.4 Section Exercises12.4 節末問題

Solution 1解答 1

The xy term causes a rotation of the graph to occur.

xy の項がグラフの回転を起こす。

Solution 3解答 3

The conic section is a hyperbola.

この円錐曲線は双曲線である。

Solution 5解答 5

It gives the angle of rotation of the axes in order to eliminate the xy term.

これは、xy の項を消すための座標軸の回転角を与える。

Solution 7解答 7

AB=0, parabola

AB=0 放物線

Solution 9解答 9

AB=4<0, hyperbola

AB=4<0 双曲線

Solution 11解答 11

AB=6>0, ellipse

AB=6>0 楕円

Solution 13解答 13

B 2 4AC=0, parabola

B 2 4AC=0 放物線

Solution 15解答 15

B 2 4AC=0, parabola

B 2 4AC=0 放物線

Solution 17解答 17

B 2 4AC=96<0, ellipse

B 2 4AC=96<0 楕円

Solution 19解答 19

7x 2 +9y 2 4=0

Solution 21解答 21

3x 2 +2x y 5y 2 +1=0

Solution 23解答 23

θ=60 ,11x 2 y 2 +3 x +y 4=0

Solution 25解答 25

θ=- 30 ,21x 2 +9y 2 +4x 43 y 6=0

Solution 27解答 27

θ36.9 ,125x 2 +6x 42y +10=0

Solution 29解答 29

θ=45 ,3x 2 y 2 2 x +2 y +1=0

Solution 31解答 31

2 2 ( x +y )=1 2 ( x y ) 2

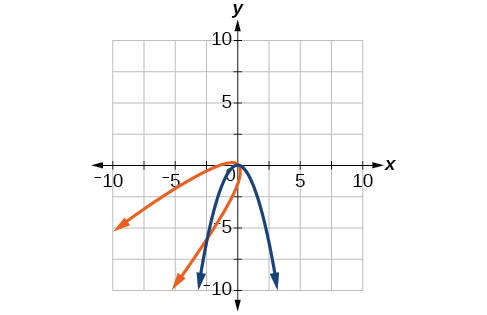
A coordinate plane displays two parabolas with their vertices at the origin. A blue parabola opens downwards, and an orange parabola opens to the left.

Solution 33解答 33

( x y ) 2 8 +( x +y ) 2 2 =1

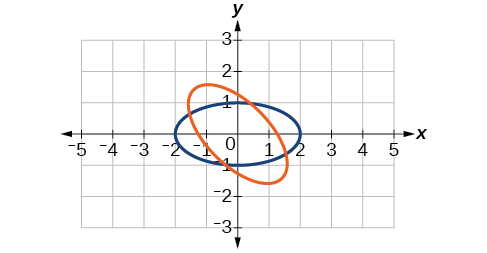
A coordinate plane shows two intersecting ellipses. One is blue and appears more horizontally oriented, while the other is orange and appears more vertically oriented. Both are centered near the origin.

Solution 35解答 35

( x +y ) 2 2 ( x y ) 2 2 =1

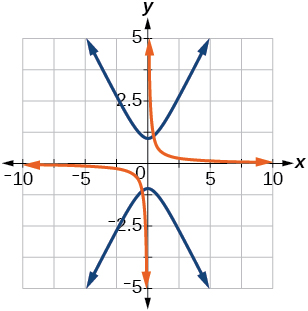
A graph displays two hyperbolas centered at the origin on a Cartesian coordinate plane. One hyperbola, shown in orange, opens horizontally, while the other, in blue, opens vertically.

Solution 37解答 37

3 2 x 1 2 y =( 1 2 x +3 2 y 1 ) 2

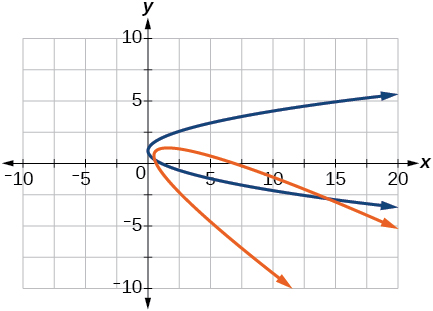
A graph displays two parabolas. The blue parabola opens to the right with its vertex at the origin (0,0). The orange parabola opens downwards with its vertex at (2,1).

Solution 39解答 39

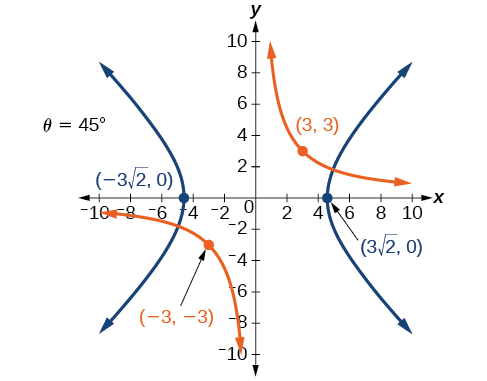
This graph illustrates two hyperbolas rotated by 45 degrees. The blue hyperbola opens left and right, with vertices at ( 3 2 , 0) and (- 3 2 , 0). The orange hyperbola opens up and down, passing through (3, 3) and (-3, -3).

Solution 41解答 41

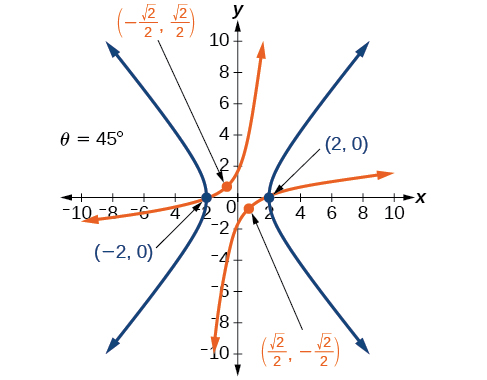
A graph of a hyperbola rotated by 45 degrees. The x-axis and y-axis both range from -10 to 10. The vertices of the hyperbola are at (-2, 0) and (2, 0). The foci are indicated at (negative square root of 2 over 2, square root of 2 over 2) and (square root of 2 over 2, negative square root of 2 over 2). The rotation angle is labeled as theta = 45 degrees.

Solution 43解答 43

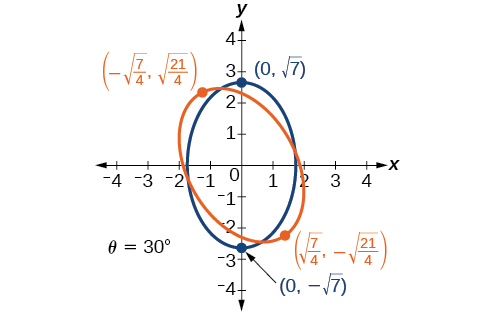
Two ellipses are shown on a coordinate plane. The blue ellipse is centered at the origin, and the orange ellipse is rotated by 30 degrees. Their intersection points are labeled.

Solution 45解答 45

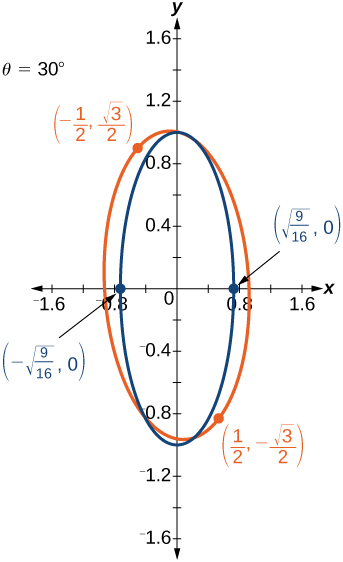
Two ellipses on a coordinate plane. Blue ellipse is axis-aligned with x-intercepts (+/- sqrt(9/16), 0). Orange ellipse is rotated 30 degrees, with points (-1/2, sqrt(3)/2) and (1/2, -sqrt(3)/2) labeled.

Solution 47解答 47

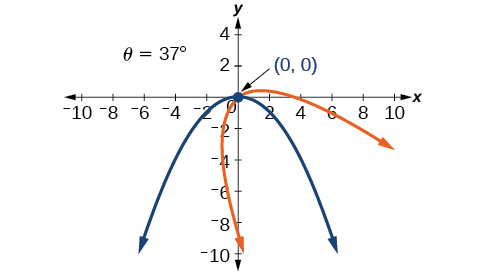
Two parabolic paths, starting at (0,0), are plotted on an x-y plane. The blue path goes downwards, and the orange path moves right and down. An angle of 37° is indicated.

Solution 49解答 49

A coordinate plane displays two parabolas starting at (0,0). The blue parabola opens along the positive x-axis. The orange parabola is rotated by an angle

Solution 51解答 51

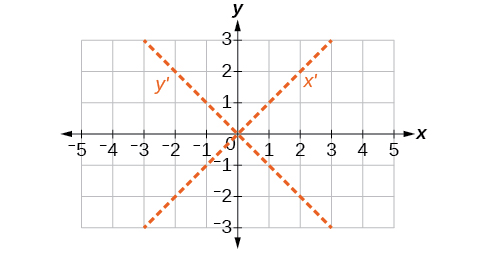
θ=45

A graph on a Cartesian coordinate system shows the x-axis and y-axis, each ranging from -5 to 5. Two dashed lines are drawn, both passing through the origin. One dashed line is labeled y' and goes from top-left to bottom-right, representing the equation y = -x. The other dashed line is labeled x' and goes from bottom-left to top-right, representing the equation y = x. These dashed lines illustrate a rotation of the coordinate axes.

Solution 53解答 53

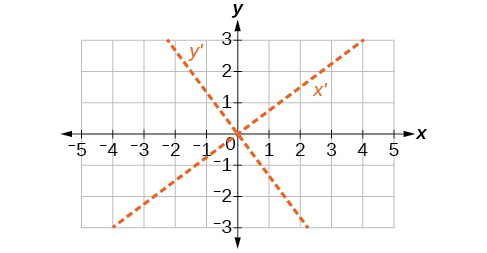
θ=60

A Cartesian coordinate system with original x and y axes and two dashed lines, x' and y', both passing through the origin. x' has a positive slope, and y' has a negative slope.

Solution 55解答 55

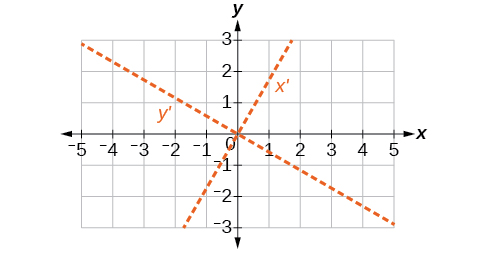
θ36.9

A graph illustrating two sets of coordinate axes, (x, y) and a rotated set (x', y'), both intersecting at the origin. The x' and y' axes are shown as dashed orange lines.

Solution 57解答 57

46 <k<46

Solution 59解答 59

k=2

12.5 Section Exercises12.5 節末問題

Solution 1解答 1

If eccentricity is less than 1, it is an ellipse. If eccentricity is equal to 1, it is a parabola. If eccentricity is greater than 1, it is a hyperbola.

離心率が1より小さければ楕円である。離心率が1に等しければ放物線である。離心率が1より大きければ双曲線である。
Solution 3解答 3

The directrix will be parallel to the polar axis.

準線は極軸に平行になる。

Solution 5解答 5

One of the foci will be located at the origin.

焦点の一つが原点に位置する。

Solution 7解答 7

Parabola with e=1 and directrix 3 4 units below the pole.

e=1 の放物線。準線は極の 3 4 下。

Solution 9解答 9

Hyperbola with e=2 and directrix 5 2 units above the pole.

e=2 の双曲線。準線は極の 5 2 上。

Solution 11解答 11

Parabola with e=1 and directrix 3 10 units to the right of the pole.

e=1 の放物線。準線は極の 3 10 右。

Solution 13解答 13

Ellipse with e=2 7 and directrix 2 units to the right of the pole.

e=2 7 の楕円。準線は極の 2 右。

Solution 15解答 15

Hyperbola with e=5 3 and directrix 11 5 units above the pole.

e=5 3 の双曲線。準線は極の 11 5 上。

Solution 17解答 17

Hyperbola with e=8 7 and directrix 7 8 units to the right of the pole.

e=8 7 の双曲線。準線は極の 7 8 右。

Solution 19解答 19

25x 2 +16y 2 12y4=0

Solution 21解答 21

21x 2 4y 2 30x+9=0

Solution 23解答 23

64y 2 =48x+9

Solution 25解答 25

96y 2 25x 2 +110y+25=0

Solution 27解答 27

3x 2 +4y 2 2x1=0

Solution 29解答 29

5x 2 +9y 2 24x36=0

Solution 31解答 31

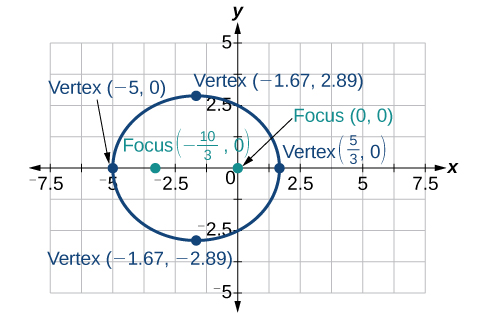
An ellipse with vertices at (-5,0), (5/3,0), (-1.67, 2.89), (-1.67, -2.89) and foci at (-10/3, 0) and (0,0) is shown on a Cartesian grid.

Solution 33解答 33

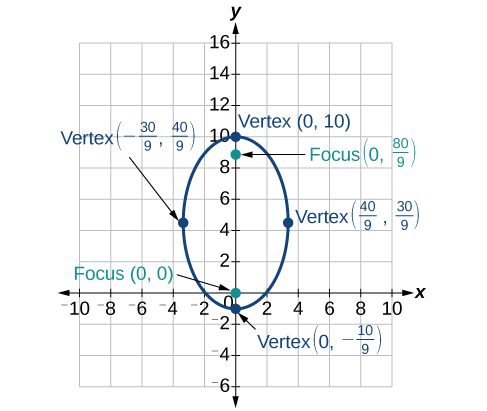
A graph of an ellipse on a Cartesian coordinate system with its four vertices labeled as (0, 10), (0, -10/9), (-30/9, 40/9), (40/9, 30/9), and two foci at (0, 80/9) and (0, 0).

Solution 35解答 35

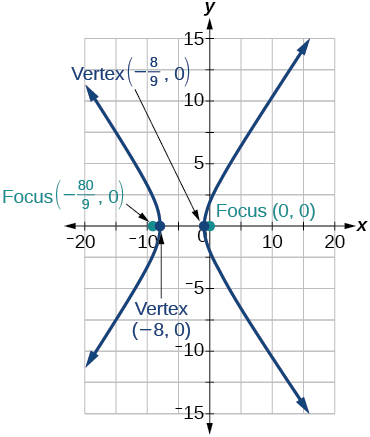
A hyperbola graph with foci (0,0) and (-80/9,0) and vertices (-8/9,0) and (-8,0). The branches open left and right along the x-axis.

Solution 37解答 37

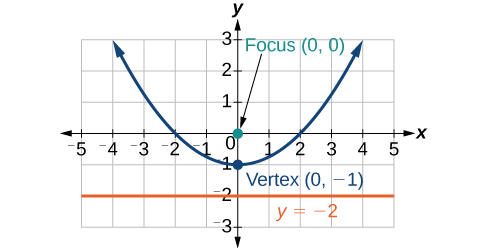
A graph displays an upward-opening parabola with its vertex at (0, -1), focus at (0, 0), and directrix at y = -2. The x-axis ranges from -5 to 5, and the y-axis from -3 to 3.

Solution 39解答 39

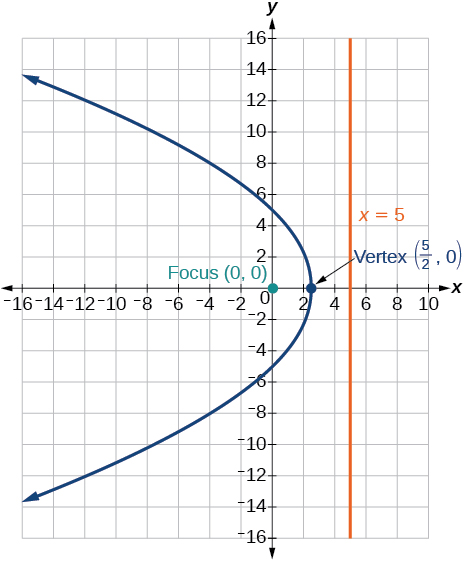
A graph of a parabola is shown on a coordinate plane. The x-axis extends from -16 to 10, and the y-axis extends from -16 to 16. The parabola opens to the left, passing through the origin of the y-axis at approximately y=4.47 and y=-4.47, and through the x-axis at 5/2 (which is 2.5). The focus of the parabola is a green dot located at the origin (0,0) and labeled

Solution 41解答 41

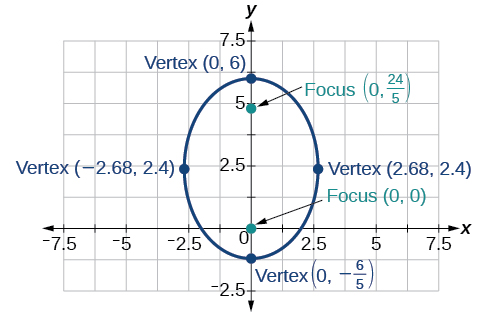
A graph displays an ellipse on a coordinate plane. The ellipse is vertically oriented. Its vertices are labeled as (0, 6), (0, -6/5), (-2.68, 2.4), and (2.68, 2.4). The foci are labeled as (0, 24/5) and (0, 0).

Solution 43解答 43

r=4 5+cosθ

Solution 45解答 45

r=4 1+2sinθ

Solution 47解答 47

r=1 1+cosθ

Solution 49解答 49

r=7 828cosθ

Solution 51解答 51

r=12 2+3sinθ

Solution 53解答 53

r=15 43cosθ

Solution 55解答 55

r=3 33cosθ

Solution 57解答 57

r=±2 1+sinθcosθ

Solution 59解答 59

r=±2 4cosθ+3sinθ

Review Exercises復習問題

Solution 1解答 1

x 2 5 2 +y 2 8 2 =1; center: ( 0,0 ); vertices: ( 5,0 ),( −5,0 ),( 0,8 ),( 0,8 ); foci: ( 0,39 ),( 0,39 )

x 2 5 2 +y 2 8 2 =1; 中心: ( 0,0 ); 頂点: ( 5,0 ),( −5,0 ),( 0,8 ),( 0,8 ); 焦点: ( 0,39 ),( 0,39 )

Solution 3解答 3

(x+3) 2 1 2 +(y2) 2 3 2 =1(3,2);(2,2),(4,2),(3,5),(3,1);( 3,2+22 ),( 3,222 )

Solution 5解答 5

center: ( 0,0 ); vertices: ( 6,0 ),( −6,0 ),( 0,3 ),( 0,−3 ); foci: ( 33 ,0 ),( 33 ,0 )

中心: ( 0,0 ); 頂点: ( 6,0 ),( −6,0 ),( 0,3 ),( 0,−3 ); 焦点: ( 33 ,0 ),( 33 ,0 )

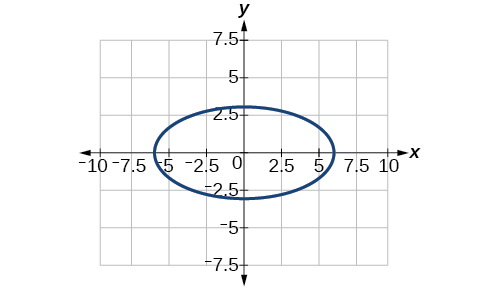
A blue ellipse is plotted on a grid. It is centered at the origin (0,0) and extends horizontally from x=-5.5 to x=5.5 and vertically from y=-3 to y=3.

Solution 7解答 7

center: ( −2,−2 ); vertices: ( 2,−2 ),( −6,−2 ),( −2,6 ),( −2,−10 ); foci: ( −2,−2+43 , ),( −2,−2−43 )

中心: ( −2,−2 ); 頂点: ( 2,−2 ),( −6,−2 ),( −2,6 ),( −2,−10 ); 焦点: ( −2,−2+43 , ),( −2,−2−43 )

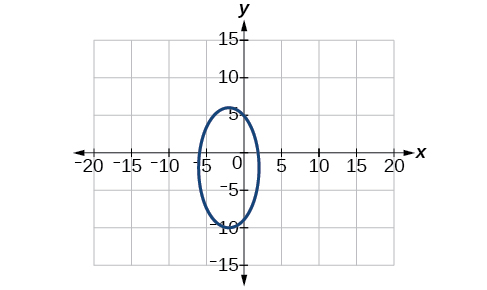
A blue ellipse is shown on a coordinate plane with x-axis ranging from -20 to 20 and y-axis from -15 to 15. The ellipse is vertically oriented, centered at (0, -2.5), with its widest points at approximately x = -2.5 and x = 2.5, and its highest and lowest points at y = 5 and y = -10, respectively.

Solution 9解答 9

x 2 25 +y 2 16 =1

Solution 11解答 11

Approximately 35.71 feet

およそ35.71フィート

Solution 13解答 13

( y+1 ) 2 4 2 ( x4 ) 2 6 2 =1; center: ( 4,−1 ); vertices: ( 4,3 ),( 4,−5 ); foci: ( 4,−1+213 ),( 4,−1213 )

( y+1 ) 2 4 2 ( x4 ) 2 6 2 =1; 中心: ( 4,−1 ); 頂点: ( 4,3 ),( 4,−5 ); 焦点: ( 4,−1+213 ),( 4,−1213 )

Solution 15解答 15

( x2 ) 2 2 2 ( y+3 ) 2 ( 23 ) 2 =1; center: ( 2,−3 ); vertices: ( 4,−3 ),( 0,−3 ); foci: ( 6,−3 ),( −2,−3 )

( x2 ) 2 2 2 ( y+3 ) 2 ( 23 ) 2 =1; 中心: ( 2,−3 ); 頂点: ( 4,−3 ),( 0,−3 ); 焦点: ( 6,−3 ),( −2,−3 )

Solution 17解答 17


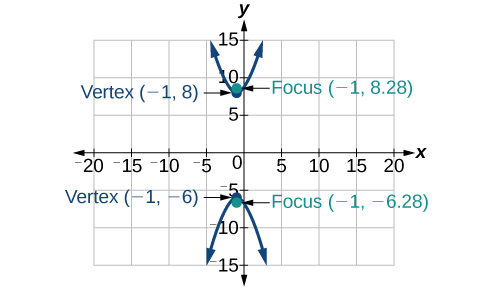
A graph displays a hyperbola centered at (-1, 1). The two vertices are at (-1, 8) and (-1, -6). The two foci are at (-1, 8.28) and (-1, -6.28).

Solution 19解答 19


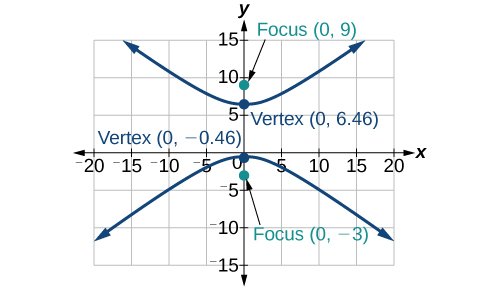
This graph illustrates a hyperbola with a vertical transverse axis, showing its two branches, vertices at (0, 6.46) and (0, -0.46), and foci at (0, 9) and (0, -3).

Solution 21解答 21

( x5 ) 2 1 ( y7 ) 2 3 =1

Solution 23解答 23

( x+2 ) 2 =1 2 ( y1 ); vertex: ( −2,1 ); focus: ( −2,9 8 ); directrix: y=7 8

( x+2 ) 2 =1 2 ( y1 ); 頂点: ( −2,1 ); 焦点: ( −2,9 8 ); 準線: y=7 8

Solution 25解答 25

( x+5 ) 2 =( y+2 ); vertex: ( 5,2 ); focus: ( 5,7 4 ); directrix: y=9 4

( x+5 ) 2 =( y+2 ); 頂点: ( 5,2 ); 焦点: ( 5,7 4 ); 準線: y=9 4

Solution 27解答 27


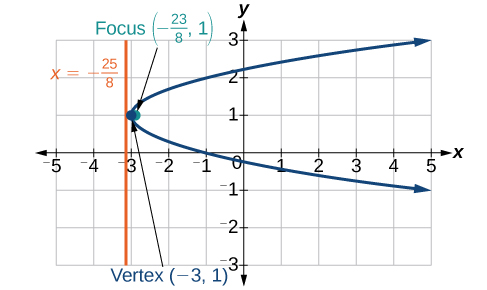
A graph on a coordinate plane displays a parabola opening to the right. The vertex of the parabola is marked at (-3, 1). The focus is labeled as the point (-23/8, 1). A vertical orange line, representing the directrix, is shown at x = -25/8. The x-axis ranges from -5 to 5, and the y-axis ranges from -3 to 3, with major grid lines at integer values.

Solution 29解答 29


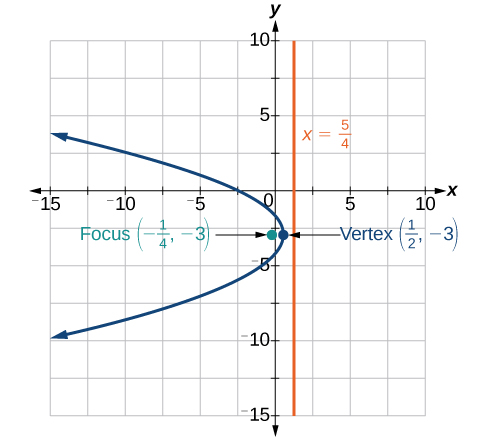
A graph displays a horizontal parabola opening left, with its vertex at (1/2, -3), focus at (-1/4, -3), and a vertical directrix line represented by x = 5/4.

Solution 31解答 31

( x2 ) 2 =( 1 2 )( y1 )

Solution 33解答 33

B 2 4AC=0, parabola

B 2 4AC=0 放物線

Solution 35解答 35

B 2 4AC=31<0, ellipse

B 2 4AC=31<0 楕円

Solution 37解答 37

θ=45 ,x 2 +3y 2 12=0

Solution 39解答 39

θ=45

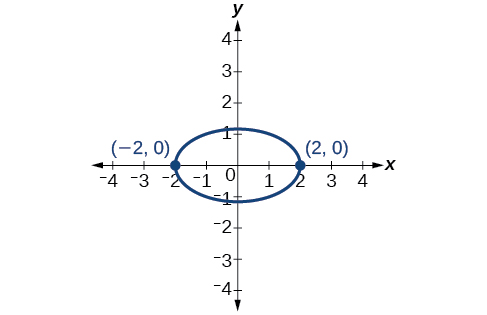
A graph on the Cartesian coordinate plane shows an ellipse centered at the origin (0,0). The x-axis extends from -4 to 4, and the y-axis extends from -4 to 4. The ellipse intersects the x-axis at (-2,0) and (2,0), and these points are explicitly labeled. The ellipse intersects the y-axis at (0,1) and (0,-1). The major axis of the ellipse lies along the x-axis and has a length of 4, while the minor axis lies along the y-axis and has a length of 2.

Solution 41解答 41

Hyperbola with e=5 and directrix 2 units to the left of the pole.

e=5 の双曲線。準線は極の 2 左。

Solution 43解答 43

Ellipse with e=3 4 and directrix 1 3 unit above the pole.

e=3 4 の楕円。準線は極の 1 3 上。

Solution 45解答 45


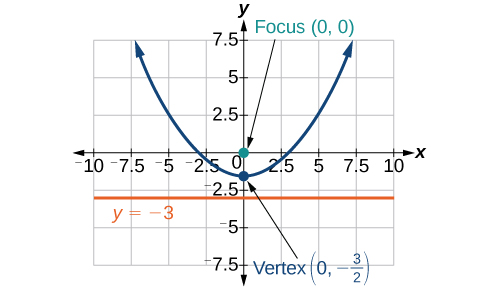
A graph illustrating a parabola opening upwards, with its focus at (0, 0), vertex at (0, -3/2), and a horizontal directrix line labeled y = -3.

Solution 47解答 47


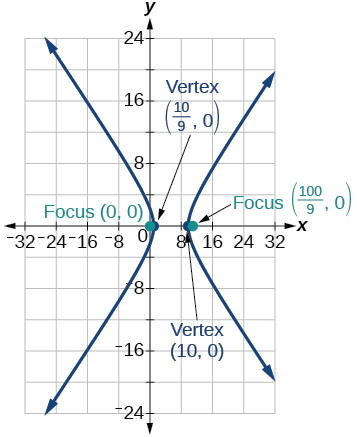
A horizontal hyperbola graph opens left and right. Its vertices are at (10/9, 0) and (10, 0), and its foci are at (0, 0) and (100/9, 0).

Solution 49解答 49

r=3 1+cos θ

Practice Test実力テスト

Solution 1解答 1

x 2 3 2 +y 2 2 2 =1; center: ( 0,0 ); vertices: ( 3,0 ),( –3,0 ),( 0,2 ),( 0,−2 ); foci: ( 5 ,0 ),( 5 ,0 )

x 2 3 2 +y 2 2 2 =1; 中心: ( 0,0 ); 頂点: ( 3,0 ),( –3,0 ),( 0,2 ),( 0,−2 ); 焦点: ( 5 ,0 ),( 5 ,0 )

Solution 3解答 3

center: ( 3,2 ); vertices: ( 11,2 ),( −5,2 ),( 3,8 ),( 3,−4 ); foci: ( 3+27 ,2 ),( 327 ,2 )

中心: ( 3,2 ); 頂点: ( 11,2 ),( −5,2 ),( 3,8 ),( 3,−4 ); 焦点: ( 3+27 ,2 ),( 327 ,2 )

An ellipse is graphed on a Cartesian coordinate plane. The ellipse is centered at (3, 2) and extends horizontally from x = -4 to x = 10, and vertically from y = -3 to y = 7.

Solution 5解答 5

( x1 ) 2 36 +( y2 ) 2 27 =1

Solution 7解答 7

x 2 7 2 y 2 9 2 =1; center: ( 0,0 ); vertices ( 7,0 ),( −7,0 ); foci: ( 130 ,0 ),( 130 ,0 ); asymptotes: y=±9 7 x

x 2 7 2 y 2 9 2 =1; 中心: ( 0,0 ); 頂点 ( 7,0 ),( −7,0 ); 焦点: ( 130 ,0 ),( 130 ,0 ); 漸近線: y=±9 7 x

Solution 9解答 9

center: ( 3,−3 ); vertices: ( 8,−3 ),( −2,−3 ); foci: ( 3+26 ,−3 ),( 326 ,−3 ); asymptotes: y=±1 5 (x3)3

中心: ( 3,−3 ); 頂点: ( 8,−3 ),( −2,−3 ); 焦点: ( 3+26 ,−3 ),( 326 ,−3 ); 漸近線: y=±1 5 (x3)3

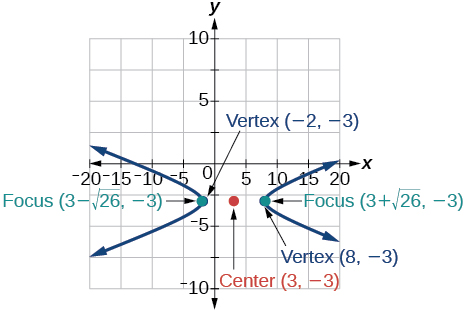
A graph plots a horizontal hyperbola opening left and right. The center is at (3, -3). Vertices are at (-2, -3) and (8, -3). Foci are at (3-sqrt(26), -3) and (3+sqrt(26), -3).

Solution 11解答 11

( y3 ) 2 1 ( x1 ) 2 8 =1

Solution 13解答 13

( x2 ) 2 =1 3 ( y+1 ); vertex: ( 2,−1 ); focus: ( 2,11 12 ); directrix: y=13 12

( x2 ) 2 =1 3 ( y+1 ); 頂点: ( 2,−1 ); 焦点: ( 2,11 12 ); 準線: y=13 12

Solution 15解答 15


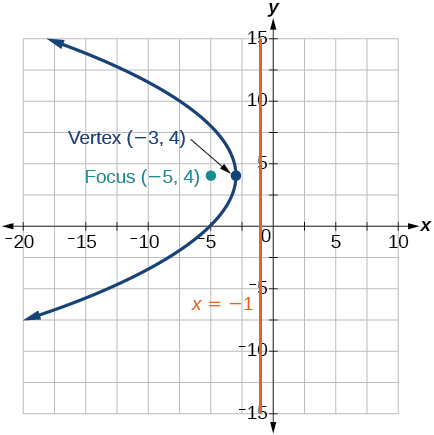
A graph displays a parabola plotted on a coordinate plane. The x-axis ranges from -20 to 10 and the y-axis from -15 to 15, with grid lines at intervals of 5. The parabola opens to the left. The vertex of the parabola is marked at (-3, 4) with a dark blue dot and labeled as

Solution 17解答 17

Approximately 8.49 feet

およそ 8.49 フィート

Solution 19解答 19

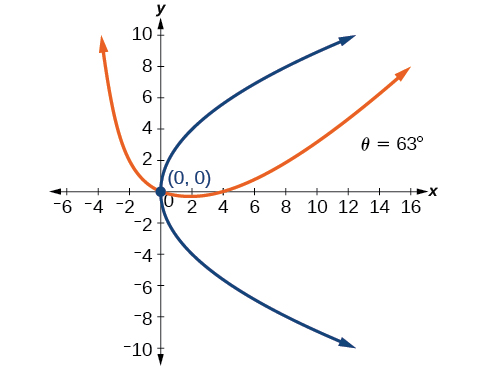
parabola; θ63.4

放物線。θ63.4

Solution 21解答 21

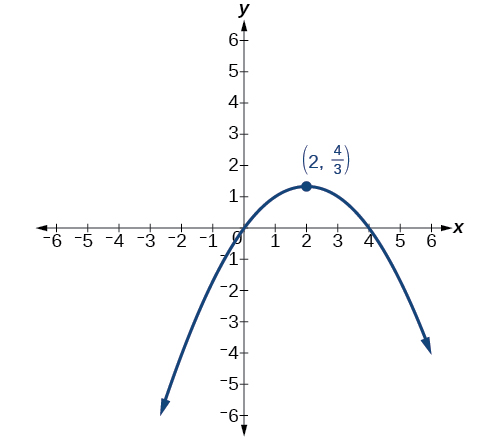
x 2 4x +3y =0

A Cartesian coordinate system displays a parabola that opens downwards. The x-axis is labeled from -6 to 6, and the y-axis is labeled from -6 to 6. The parabola passes through the origin (0,0) and appears to cross the x-axis again at x=4. Its vertex is indicated by a blue dot and labeled with the coordinates (2, 4/3). The curve extends infinitely downwards on both ends, indicated by arrows.

Solution 23解答 23

Hyperbola with e=3 2 , and directrix 5 6 units to the right of the pole.

e=3 2 の双曲線。準線は極の 5 6 右。

Solution 25解答 25

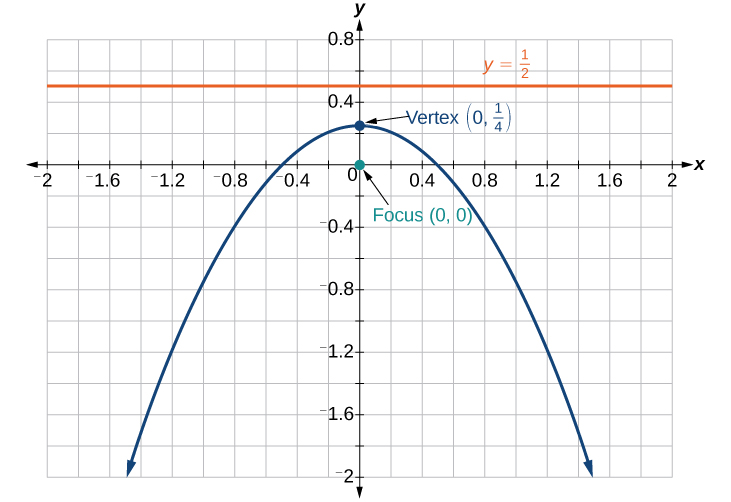
A downward-opening parabola is graphed. Its vertex is at (0, 1/4) and its focus is at (0, 0). The directrix is the horizontal line y = 1/2, shown above the vertex.