第12章解析幾何Analytic Geometry
Graphing Hyperbolas Centered at the Origin原点を中心とする双曲線のグラフを描く
When we have an equation in standard form for a hyperbola centered at the origin, we can interpret its parts to identify the key features of its graph: the center, vertices, co-vertices, asymptotes, foci, and lengths and positions of the transverse and conjugate axes. To graph hyperbolas centered at the origin, we use the standard form for horizontal hyperbolas and the standard form for vertical hyperbolas.
原点を中心とする双曲線の式が標準の形で与えられたとき、その各部分を読み解けば、グラフの要となる特徴、すなわち中心、頂点、余頂点、漸近線、焦点、主軸と共役軸の長さと位置が見分けられる。原点を中心とする双曲線のグラフを描くには、横向きの双曲線には標準の形 、縦向きの双曲線には標準の形 を使う。
How To 手順
Given a standard form equation for a hyperbola centered at sketch the graph.
を中心とする双曲線の式が標準の形で与えられたとき、グラフの概形を描く。
1. Determine which of the standard forms applies to the given equation.2. Use the standard form identified in Step 1 to determine the position of the transverse axis; coordinates for the vertices, co-vertices, and foci; and the equations for the asymptotes. If the equation is in the form then the transverse axis is on the x-axis the coordinates of the vertices are the coordinates of the co-vertices are the coordinates of the foci are the equations of the asymptotes are If the equation is in the form then the transverse axis is on the y-axis the coordinates of the vertices are the coordinates of the co-vertices are the coordinates of the foci are the equations of the asymptotes are 3. Solve for the coordinates of the foci using the equation 4. Plot the vertices, co-vertices, foci, and asymptotes in the coordinate plane, and draw a smooth curve to form the hyperbola.
1. 与えられた式にどちらの標準の形が当てはまるかを決める。2. 第1歩で見分けた標準の形を使って、主軸の位置、頂点・余頂点・焦点の座標、漸近線の式を決める。式が の形なら、主軸は x軸上、頂点の座標は 、余頂点の座標は 、焦点の座標は 、漸近線の式は である。式が の形なら、主軸は y軸上、頂点の座標は 、余頂点の座標は 、焦点の座標は 、漸近線の式は である。3. 式 を使って焦点の座標について解く。4. 頂点、余頂点、焦点、漸近線を座標平面に打ち、なめらかな曲線を描いて双曲線を作る。
Example 4例4
Graphing a Hyperbola Centered at (0, 0) Given an Equation in Standard Form式が標準の形で与えられたときに (0, 0) を中心とする双曲線のグラフを描く
Graph the hyperbola given by the equation Identify and label the vertices, co-vertices, foci, and asymptotes.
式 で与えられる双曲線のグラフを描け。頂点、余頂点、焦点、漸近線を見分けて印を付けよ。
Solution 解答
The standard form that applies to the given equation is Thus, the transverse axis is on the y-axis
与えられた式に当てはまる標準の形は である。よって主軸は y軸上にある。
The coordinates of the vertices are
頂点の座標は である。
The coordinates of the co-vertices are
余頂点の座標は である。
The coordinates of the foci are where Solving for we have
焦点の座標は である。ここで 。 について解くと、次を得る。
Therefore, the coordinates of the foci are
したがって、焦点の座標は である。
The equations of the asymptotes are
漸近線の式は である。
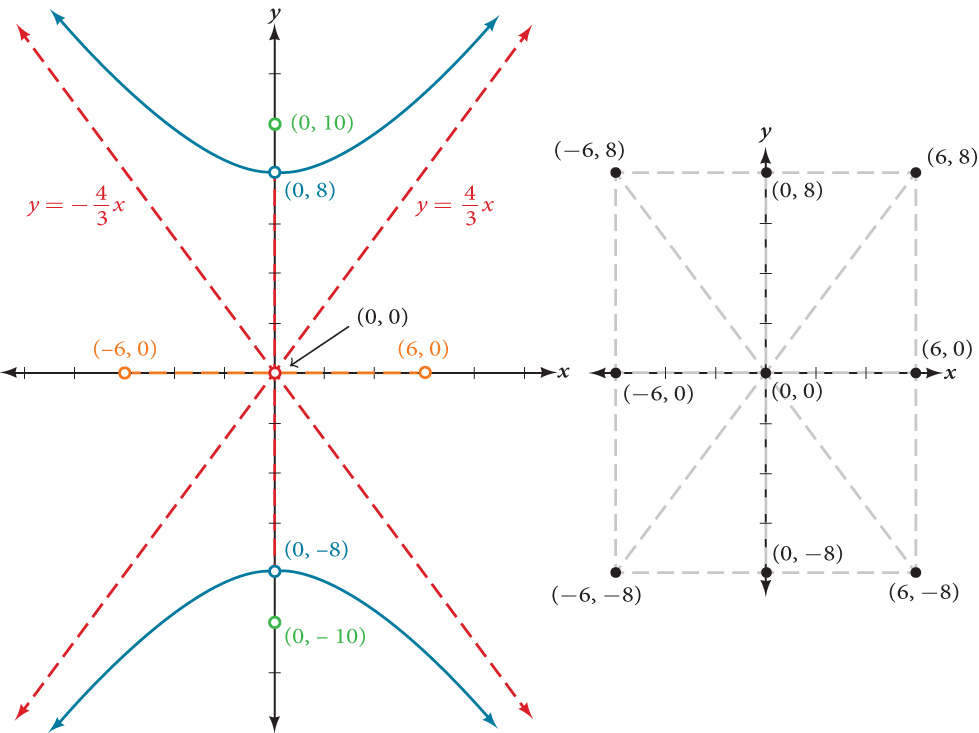
Plot and label the vertices and co-vertices, and then sketch the central rectangle. Sides of the rectangle are parallel to the axes and pass through the vertices and co-vertices. Sketch and extend the diagonals of the central rectangle to show the asymptotes. The central rectangle and asymptotes provide the framework needed to sketch an accurate graph of the hyperbola. Label the foci and asymptotes, and draw a smooth curve to form the hyperbola, as shown in Figure 8.
頂点と余頂点を打って印を付け、そして中心の長方形の概形を描く。長方形の辺は座標軸に平行で、頂点と余頂点を通る。中心の長方形の対角線を描いて延ばし、漸近線を示す。中心の長方形と漸近線は、双曲線の正確なグラフの概形を描くのに必要な骨組みを与える。焦点と漸近線に印を付け、図8に示すとおりなめらかな曲線を描いて双曲線を作る。
Try It #4やってみよう4
Graph the hyperbola given by the equation Identify and label the vertices, co-vertices, foci, and asymptotes.
式 で与えられる双曲線のグラフを描け。頂点、余頂点、焦点、漸近線を見分けて印を付けよ。