第11章連立方程式と連立不等式Systems of Equations and Inequalities
11.3 Systems of Nonlinear Equations and Inequalities: Two Variables11.3 非線形連立方程式と連立不等式: 二変数
Learning Objectives 学習目標
In this section, you will:
この節を終えると、次のことができるようになる。
• Solve a system of nonlinear equations using substitution.• Solve a system of nonlinear equations using elimination.• Graph a nonlinear inequality.• Graph a system of nonlinear inequalities.
・代入を使って非線形連立方程式を解く。・消去を使って非線形連立方程式を解く。・一次でない不等式のグラフを描く。・一次でない連立不等式のグラフを描く。
Halley’s Comet (Figure 1) orbits the sun about once every 75 years. Its path can be considered to be a very elongated ellipse. Other comets follow similar paths in space. These orbital paths can be studied using systems of equations. These systems, however, are different from the ones we considered in the previous section because the equations are not linear.
ハレー彗星(図1)は、およそ75年に一度太陽のまわりを回る。その道筋は、たいへん引き延ばされた楕円と見なせる。ほかの彗星も空間で似た道筋をたどる。この軌道の道筋は連立方程式を使って調べられる。だがこの組は、式が一次でないので、前の節で考えたものとは違う。

In this section, we will consider the intersection of a parabola and a line, a circle and a line, and a circle and an ellipse. The methods for solving systems of nonlinear equations are similar to those for linear equations.
この節では、放物線と直線、円と直線、円と楕円の交わりを考える。非線形連立方程式を解く方法は、一次方程式のものと似ている。
Solving a System of Nonlinear Equations Using Substitution代入を使って非線形連立方程式を解く
A system of nonlinear equations is a system of two or more equations in two or more variables containing at least one equation that is not linear. Recall that a linear equation can take the form Any equation that cannot be written in this form is nonlinear. The substitution method we used for linear systems is the same method we will use for nonlinear systems. We solve one equation for one variable and then substitute the result into the second equation to solve for another variable, and so on. There is, however, a variation in the possible outcomes.
非線形連立方程式とは、二つ以上の変数の二つ以上の式の組で、一次でない式を少なくとも一つ含むものである。一次方程式が の形に書けることを思い出せ。この形に書けない式はどれも一次でない。一次の組に使った代入法と同じ方法を、一次でない組にも使う。一方の式を一つの変数について解き、その結果をもう一方の式に代入して別の変数について解く、というふうに進める。だが、ありうる結果には違いがある。
Intersection of a Parabola and a Line放物線と直線の交わり
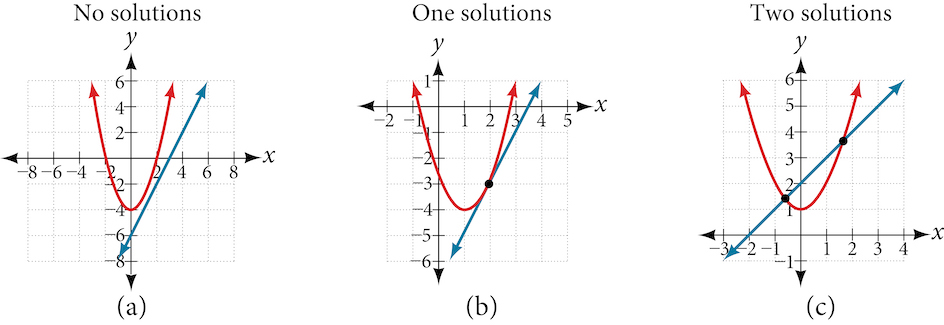
There are three possible types of solutions for a system of nonlinear equations involving a parabola and a line.
放物線と直線を含む非線形連立方程式の解には、三つの型がありうる。
Possible Types of Solutions for Points of Intersection of a Parabola and a Line 放物線と直線の交点の個数
Figure 2 illustrates possible solution sets for a system of equations involving a parabola and a line.
図2に、放物線と直線を含む連立方程式のありうる解の集合を示す。
• No solution. The line will never intersect the parabola.• One solution. The line is tangent to the parabola and intersects the parabola at exactly one point.• Two solutions. The line crosses on the inside of the parabola and intersects the parabola at two points.
・解が無い。直線は放物線とけっして交わらない。・解が一つ。直線は放物線に接し、ちょうど一点で交わる。・解が二つ。直線は放物線の内側を横切り、二点で交わる。
How To 手順
Given a system of equations containing a line and a parabola, find the solution.
直線と放物線を含む連立方程式が与えられたとき、その解を求める。
1. Solve the linear equation for one of the variables.2. Substitute the expression obtained in step one into the parabola equation.3. Solve for the remaining variable.4. Check your solutions in both equations.
1. 一次方程式を一方の変数について解く。2. 第一歩で得た式を放物線の式に代入する。3. 残りの変数について解く。4. 両方の式で解を確かめる。
Example 1例1
Solving a System of Nonlinear Equations Representing a Parabola and a Line放物線と直線を表す非線形連立方程式を解く
Solve the system of equations.
この連立方程式を解け。
Solution 解答
Solve the first equation for and then substitute the resulting expression into the second equation.
一つ目の式を について解き、そして得た式を二つ目の式に代入する。
Expand the equation and set it equal to zero.
式を展開し、零に等しいと置く。
Solving for gives and Next, substitute each value for into the first equation to solve for Always substitute the value into the linear equation to check for extraneous solutions.
について解くと と が得られる。次に、各 の値を一つ目の式に代入して について解く。無縁な解が無いか調べるため、値はつねに一次方程式のほうに代入せよ。
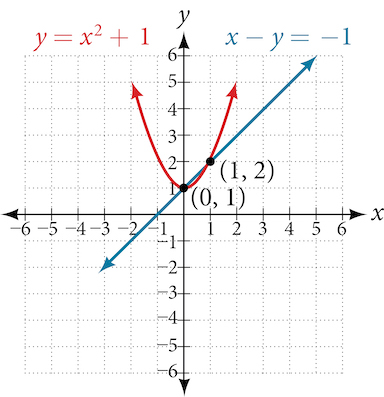
The solutions are and which can be verified by substituting these values into both of the original equations. See Figure 3.
解は と であり、これらの の値を元の両方の式に代入すれば確かめられる。図3を見よ。
Q&A 疑問と答え
Could we have substituted values for into the second equation to solve for in Example 1?
例1で の値を二つ目の式に代入して について解くこともできたか。
Yes, but because is squared in the second equation this could give us extraneous solutions for
できるが、二つ目の式では が平方されているので、 について無縁な解が出ることがある。
For
のとき
This gives us the same value as in the solution.
これは解と同じ値を与える。
For
のとき
Notice that is an extraneous solution.
が無縁な解であることに注意せよ。
Try It #1やってみよう1
Solve the given system of equations by substitution.
与えられた連立方程式を代入で解け。
Intersection of a Circle and a Line円と直線の交わり
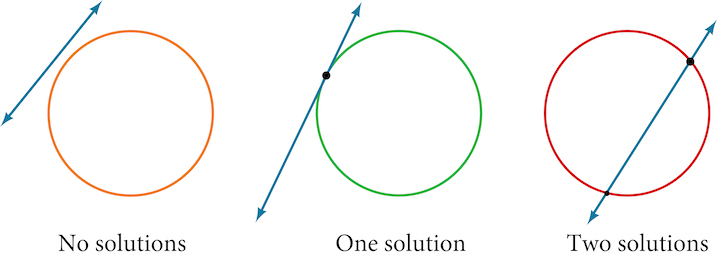
Just as with a parabola and a line, there are three possible outcomes when solving a system of equations representing a circle and a line.
放物線と直線のときと同じく、円と直線を表す連立方程式を解くときも、ありうる結果は三つある。
Possible Types of Solutions for the Points of Intersection of a Circle and a Line 円と直線の交点の個数
Figure 4 illustrates possible solution sets for a system of equations involving a circle and a line.
図4に、円と直線を含む連立方程式のありうる解の集合を示す。
• No solution. The line does not intersect the circle.• One solution. The line is tangent to the circle and intersects the circle at exactly one point.• Two solutions. The line crosses the circle and intersects it at two points.
・解が無い。直線は円と交わらない。・解が一つ。直線は円に接し、ちょうど一点で交わる。・解が二つ。直線は円を横切り、二点で交わる。
How To 手順
Given a system of equations containing a line and a circle, find the solution.
直線と円を含む連立方程式が与えられたとき、その解を求める。
1. Solve the linear equation for one of the variables.2. Substitute the expression obtained in step one into the equation for the circle.3. Solve for the remaining variable.4. Check your solutions in both equations.
1. 一次方程式を一方の変数について解く。2. 第一歩で得た式を円の式に代入する。3. 残りの変数について解く。4. 両方の式で解を確かめる。
Example 2例2
Finding the Intersection of a Circle and a Line by Substitution代入で円と直線の交わりを求める
Find the intersection of the given circle and the given line by substitution.
与えられた円と与えられた直線の交わりを代入で求めよ。
Solution 解答
One of the equations has already been solved for We will substitute into the equation for the circle.
一方の式はすでに について解かれている。円の式に を代入する。
Now, we factor and solve for
では因数分解して について解く。
Substitute the two x-values into the original linear equation to solve for
二つの x の値を元の一次方程式に代入して について解く。
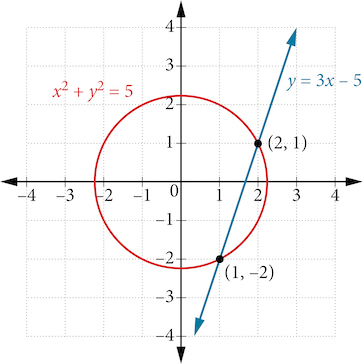
The line intersects the circle at and which can be verified by substituting these values into both of the original equations. See Figure 5.
直線は円と と で交わる。これらの の値を元の両方の式に代入すれば確かめられる。図5を見よ。
Try It #2やってみよう2
Solve the system of nonlinear equations.
この非線形連立方程式を解け。
Solving a System of Nonlinear Equations Using Elimination消去を使って非線形連立方程式を解く
We have seen that substitution is often the preferred method when a system of equations includes a linear equation and a nonlinear equation. However, when both equations in the system have like variables of the second degree, solving them using elimination by addition is often easier than substitution. Generally, elimination is a far simpler method when the system involves only two equations in two variables (a two-by-two system), rather than a three-by-three system, as there are fewer steps. As an example, we will investigate the possible types of solutions when solving a system of equations representing a circle and an ellipse.
連立方程式に一次方程式と一次でない式が含まれるときは、代入がしばしば好まれる方法だと見てきた。だが組の両方の式に同じ二次の変数があるときは、足し算による消去で解くほうが代入より楽なことが多い。一般に、組が三元でなく二変数二式(二元の組)だけを含むときは、手順が少ないので消去のほうがはるかに簡単な方法である。例として、円と楕円を表す連立方程式を解くときにありうる解の型を調べる。
Possible Types of Solutions for the Points of Intersection of a Circle and an Ellipse 円と楕円の交点の個数
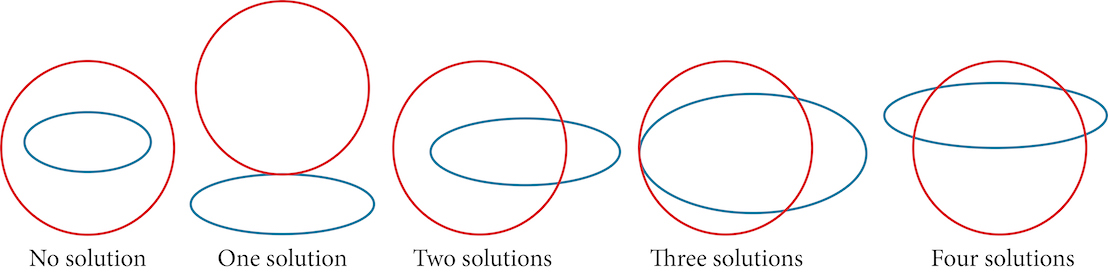
Figure 6 illustrates possible solution sets for a system of equations involving a circle and an ellipse.
図6に、円と楕円を含む連立方程式のありうる解の集合を示す。
• No solution. The circle and ellipse do not intersect. One shape is inside the other or the circle and the ellipse are a distance away from the other.• One solution. The circle and ellipse are tangent to each other, and intersect at exactly one point.• Two solutions. The circle and the ellipse intersect at two points.• Three solutions. The circle and the ellipse intersect at three points.• Four solutions. The circle and the ellipse intersect at four points.
・解が無い。円と楕円は交わらない。一方が他方の内側にあるか、円と楕円が離れている。・解が一つ。円と楕円は互いに接し、ちょうど一点で交わる。・解が二つ。円と楕円は二点で交わる。・解が三つ。円と楕円は三点で交わる。・解が四つ。円と楕円は四点で交わる。
Example 3例3
Solving a System of Nonlinear Equations Representing a Circle and an Ellipse円と楕円を表す非線形連立方程式を解く
Solve the system of nonlinear equations.
この非線形連立方程式を解け。
Solution 解答
Let’s begin by multiplying equation (1) by and adding it to equation (2).
まず式(1)に を掛けて式(2)に足そう。
After we add the two equations together, we solve for
二つの式を足し合わせたら、 について解く。
Substitute into one of the equations and solve for
を式の一方に代入し、 について解く。
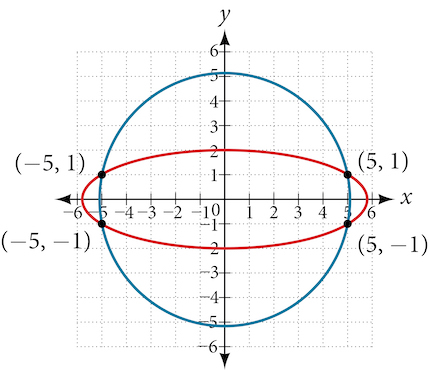
There are four solutions: See Figure 7.
解は四つある。 である。図7を見よ。
Try It #3やってみよう3
Find the solution set for the given system of nonlinear equations.
与えられた非線形連立方程式の解の集合を求めよ。
Graphing a Nonlinear Inequality一次でない不等式のグラフを描く
All of the equations in the systems that we have encountered so far have involved equalities, but we may also encounter systems that involve inequalities. We have already learned to graph linear inequalities by graphing the corresponding equation, and then shading the region represented by the inequality symbol. Now, we will follow similar steps to graph a nonlinear inequality so that we can learn to solve systems of nonlinear inequalities. A nonlinear inequality is an inequality containing a nonlinear expression. Graphing a nonlinear inequality is much like graphing a linear inequality.
ここまで出会った組の式はすべて等式を含んでいたが、不等式を含む組に出会うこともある。一次不等式のグラフは、対応する式のグラフを描き、そして不等号が表す領域に影を付ければ描けると、すでに学んだ。ここでは同じような手順に従って一次でない不等式のグラフを描き、一次でない連立不等式を解けるようにする。一次でない不等式とは、一次でない式を含む不等式である。一次でない不等式のグラフを描くのは、一次不等式のグラフを描くのとよく似ている。
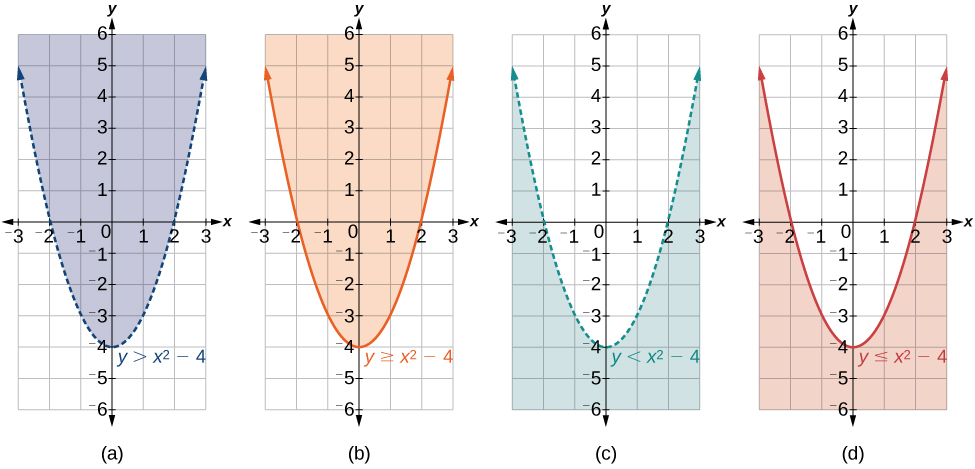
Recall that when the inequality is greater than, or less than, the graph is drawn with a dashed line. When the inequality is greater than or equal to, or less than or equal to, the graph is drawn with a solid line. The graphs will create regions in the plane, and we will test each region for a solution. If one point in the region works, the whole region works. That is the region we shade. See Figure 8.
不等号が「より大きい」 や「より小さい」 のときは、グラフを破線で描くことを思い出せ。不等号が「以上」 や「以下」 のときは、グラフを実線で描く。グラフは平面にいくつかの領域を作り、各領域が解かどうかを調べる。その領域の一点が成り立てば、その領域全体が成り立つ。それが影を付ける領域である。図8を見よ。
How To 手順
Given an inequality bounded by a parabola, sketch a graph.
放物線で囲まれた不等式が与えられたとき、グラフの概形を描く。
1. Graph the parabola as if it were an equation. This is the boundary for the region that is the solution set.2. If the boundary is included in the region (the operator is or ), the parabola is graphed as a solid line.3. If the boundary is not included in the region (the operator is < or >), the parabola is graphed as a dashed line.4. Test a point in one of the regions to determine whether it satisfies the inequality statement. If the statement is true, the solution set is the region including the point. If the statement is false, the solution set is the region on the other side of the boundary line.5. Shade the region representing the solution set.
1. 放物線を、式であるかのようにグラフに描く。これが解の集合となる領域の境界である。2. 境界がその領域に含まれるなら(記号が か のとき)、放物線は実線で描く。3. 境界がその領域に含まれないなら(記号が < か > のとき)、放物線は破線で描く。4. どちらかの領域の一点を調べ、それが不等式を満たすかどうかを判定する。式が正しいなら、解の集合はその点を含む領域である。式が正しくないなら、解の集合は境界線の反対側の領域である。5. 解の集合を表す領域に影を付ける。
Example 4例4
Graphing an Inequality for a Parabola放物線の不等式のグラフを描く
Graph the inequality
不等式 のグラフを描け。
Solution 解答
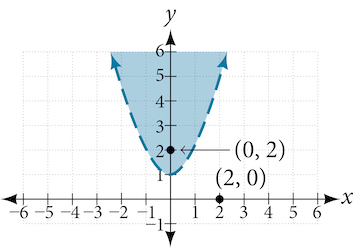
First, graph the corresponding equation Since has a greater than symbol, we draw the graph with a dashed line. Then we choose points to test both inside and outside the parabola. Let’s test the points
and One point is clearly inside the parabola and the other point is clearly outside.
まず、対応する式 のグラフを描く。 は「より大きい」の記号を持つので、グラフは破線で描く。そして放物線の内側と外側の両方で調べる点を選ぶ。点 と を調べよう。一方は明らかに放物線の内側にあり、もう一方は明らかに外側にある。
The graph is shown in Figure 9. We can see that the solution set consists of all points inside the parabola, but not on the graph itself.
グラフを図9に示す。解の集合が放物線の内側のすべての点からなり、グラフそのものの上の点は含まないことが分かる。
Graphing a System of Nonlinear Inequalities一次でない連立不等式のグラフを描く
Now that we have learned to graph nonlinear inequalities, we can learn how to graph systems of nonlinear inequalities. A system of nonlinear inequalities is a system of two or more inequalities in two or more variables containing at least one inequality that is not linear. Graphing a system of nonlinear inequalities is similar to graphing a system of linear inequalities. The difference is that our graph may result in more shaded regions that represent a solution than we find in a system of linear inequalities. The solution to a nonlinear system of inequalities is the region of the graph where the shaded regions of the graph of each inequality overlap, or where the regions intersect, called the feasible region.
一次でない不等式のグラフの描きかたを学んだので、一次でない連立不等式のグラフの描きかたを学べる。一次でない連立不等式とは、二つ以上の変数の二つ以上の不等式の組で、一次でない不等式を少なくとも一つ含むものである。一次でない連立不等式のグラフを描くのは、一次の連立不等式のグラフを描くのと似ている。違うのは、一次の連立不等式より、解を表す影の領域が多くできることがある点である。一次でない連立不等式の解は、各不等式のグラフの影の領域が重なるところ、すなわち領域が交わるところであり、これを実行可能領域という。
How To 手順
Given a system of nonlinear inequalities, sketch a graph.
一次でない連立不等式が与えられたとき、グラフの概形を描く。
1. Find the intersection points by solving the corresponding system of nonlinear equations.2. Graph the nonlinear equations.3. Find the shaded regions of each inequality.4. Identify the feasible region as the intersection of the shaded regions of each inequality or the set of points common to each inequality.
1. 対応する非線形連立方程式を解いて交点を求める。2. 一次でない式のグラフを描く。3. 各不等式の影の領域を求める。4. 各不等式の影の領域の交わり、すなわち各不等式に共通の点の集合を実行可能領域として見分ける。
Example 5例5
Graphing a System of Inequalities連立不等式のグラフを描く
Graph the given system of inequalities.
与えられた連立不等式のグラフを描け。
Solution 解答
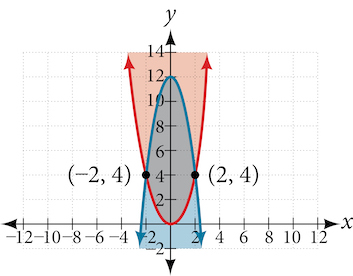
These two equations are clearly parabolas. We can find the points of intersection by the elimination process: Add both equations and the variable will be eliminated. Then we solve for
この二つの式は明らかに放物線である。交点は消去の手順で求められる。両方の式を足すと変数 が消える。そして について解く。
Substitute the x-values into one of the equations and solve for
x の値を式の一方に代入し、 について解く。
The two points of intersection are and Notice that the equations can be rewritten as follows.
二つの交点は と である。この式は次のように書き直せることに注意せよ。
Graph each inequality. See Figure 10. The feasible region is the region between the two equations bounded by on the top and on the bottom.
各不等式のグラフを描く。図10を見よ。実行可能領域は、上を 、下を で囲まれた、二つの式のあいだの領域である。
Try It #4やってみよう4
Graph the given system of inequalities.
与えられた連立不等式のグラフを描け。
Media 教材
Access these online resources for additional instruction and practice with nonlinear equations.
一次でない式についての説明と練習をさらに求めるなら、次のオンライン教材にあたるとよい。
• Solve a System of Nonlinear Equations Using Substitution• Solve a System of Nonlinear Equations Using Elimination
・代入を使って非線形連立方程式を解く・消去を使って非線形連立方程式を解く
Verbal言葉で答える問題
1. Explain whether a system of two nonlinear equations can have exactly two solutions. What about exactly three? If not, explain why not. If so, give an example of such a system, in graph form, and explain why your choice gives two or three answers.
1. 一次でない二つの式の組に、解がちょうど二つあることはありうるかを説明せよ。ちょうど三つのときはどうか。ありえないなら、なぜありえないかを説明せよ。ありうるなら、そのような組の例をグラフの形で挙げ、なぜその選び方で答えが二つや三つになるかを説明せよ。
2. When graphing an inequality, explain why we only need to test one point to determine whether an entire region is the solution?
2. 不等式のグラフを描くとき、領域全体が解かどうかを決めるのに一点だけ調べればよいのはなぜかを説明せよ。
3. When you graph a system of inequalities, will there always be a feasible region? If so, explain why. If not, give an example of a graph of inequalities that does not have a feasible region. Why does it not have a feasible region?
3. 連立不等式のグラフを描くとき、実行可能領域はつねにあるか。あるならその理由を説明せよ。ないなら、実行可能領域を持たない不等式のグラフの例を挙げよ。なぜ実行可能領域が無いのか。
4. If you graph a revenue and cost function, explain how to determine in what regions there is profit.
4. 収入関数と費用関数のグラフを描くとき、どの領域で利益が出るかをどう決めるかを説明せよ。
Algebraic代数の問題
For the following exercises, solve the system of nonlinear equations using substitution.
次の各問について、代入を使ってこの非線形連立方程式を解け。
For the following exercises, solve the system of nonlinear equations using elimination.
次の各問について、消去を使ってこの非線形連立方程式を解け。
For the following exercises, use any method to solve the system of nonlinear equations.
次の各問について、どの方法を使ってもよいのでこの非線形連立方程式を解け。
For the following exercises, use any method to solve the nonlinear system.
次の各問について、どの方法を使ってもよいのでこの一次でない組を解け。
Graphicalグラフの問題
For the following exercises, graph the inequality.
次の各問について、この不等式のグラフを描け。
For the following exercises, graph the system of inequalities. Label all points of intersection.
次の各問について、この連立不等式のグラフを描け。交点にはすべて印を付けよ。
Extensions発展問題
For the following exercises, graph the inequality.
次の各問について、この不等式のグラフを描け。
For the following exercises, find the solutions to the nonlinear equations with two variables.
次の各問について、二変数の一次でない式の解を求めよ。
Technology機器を使う問題
For the following exercises, solve the system of inequalities. Use a calculator to graph the system to confirm the answer.
次の各問について、この連立不等式を解け。電卓でこの組のグラフを描き、答えを確かめよ。
Real-World Applications現実世界への応用
For the following exercises, construct a system of nonlinear equations to describe the given behavior, then solve for the requested solutions.
次の各問について、与えられた振る舞いを述べる非線形連立方程式を作り、そして求められた解を求めよ。
56. The squares of two numbers add to 360. The second number is half the value of the first number squared. What are the numbers?
56. 二つの数の平方を足すと360になる。二つ目の数は、一つ目の数を平方した値の半分である。この数はいくらか。
57. A laptop company has discovered their cost and revenue functions for each day: and If they want to make a profit, what is the range of laptops per day that they should produce? Round to the nearest number which would generate profit.
57. ある携帯型計算機の会社が、一日あたりの費用関数と収入関数を突き止めた。 と である。利益を出したいとき、一日に作るべき計算機の台数の範囲はいくらか。利益が出る整数に丸めよ。
58. A cell phone company has the following cost and revenue functions: and What is the range of cell phones they should produce each day so there is profit? Round to the nearest number that generates profit.
58. ある携帯電話の会社の費用関数と収入関数は次である。 と 。利益が出るために毎日作るべき携帯電話の台数の範囲はいくらか。利益が出る整数に丸めよ。