第8章データ管理
8.5 Data Warehousing, Data Lakes, and Business Intelligence8.5 データウェアハウス、データレイク、ビジネスインテリジェンス
Learning Objectives学習目標
By the end of this section, you will be able to:
この節を学び終えると、次のことができるようになる。
• Outline the characteristics of data warehouses
• データウェアハウスの特徴を概説する
• Explain the extraction, transformation, and loading (ETL) process
• 抽出・変換・読み込み(ETL)の過程を説明する
• Discuss data marts
• データマートを論じる
• Describe the technology behind virtual data warehouses and data marts
• 仮想データウェアハウスと仮想データマートの背後にある技術を説明する
• Summarize the nature of operational data stores
• 運用データストアの性質を要約する
• Identify data lakes and their functionality
• データレイクとその機能を特定する
• Compare business intelligence and related tools
• ビジネスインテリジェンスと関連する道具を比較する
With the proliferation of data, new techniques that store and handle the data are required. Data warehousing and data lakes are used for storing big data. Business intelligence analyzes gathered data in data warehouses and data lakes to improve strategic decision-making.
英語のヒント
データの急増に伴い、保存・処理する新しい技法が必要になる。ビッグデータの保存には、データウェアハウスやデータレイクを使う。ビジネスインテリジェンスは、そこに集めたデータを分析し、戦略的な意思決定を改善する。
Data Warehouse Characteristicsデータウェアハウスの特徴
In the late 1980s, the concept of data warehouse started at IBM when researchers Barry Devlin and Paul Murphy developed the first business warehouse. A data warehouse centralizes an enterprise’s data from its databases. It supports the flow of data from operational systems to analytics/decision systems by creating a single repository of data from various sources both internal and external. In most cases, a data warehouse is a relational database that stores processed data that are optimized for gathering business insights. It collects data with predetermined structures and schema coming from transactional systems and business applications, and the data are typically used for operational reporting and analysis. A data warehouse is a collection of data designed to support management’s decision-making process and is meant to be:
英語のヒント
1980年代後半、IBMの研究者Barry DevlinとPaul Murphyが最初のビジネスウェアハウスを開発したところから、データウェアハウスの概念が始まった。データウェアハウスは、企業の各データベースのデータを集約する。社内外のさまざまな情報源から単一のリポジトリーを作り、運用システムから分析・意思決定システムへのデータの流れを支える。多くの場合、データウェアハウスは、業務上の知見を集めやすいよう最適化・処理されたデータを保存する関係データベースである。取引システムや業務アプリケーションから、あらかじめ決めた構造とスキーマを持つデータを集める。通常、データは運用上の報告と分析に使う。経営陣の意思決定を支えるために設計されたデータの集合であり、次の性質を持つことを意図している。
• Subject-oriented: data are organized based on subjects such as products.
• 主題指向:製品などの主題に基づいてデータを整理する。
• Integrated: it integrates data from multiple resources and different formats.
• 統合的:複数の情報源や異なる形式のデータを統合する。
• Time-variant: it stores a time series of periodic snapshots to always be up-to-date.
• 時間変化を保持:常に最新の状態であるように、定期的なスナップショットを時系列として保存する。
• Nonvolatile: data are read-only to complete the process of updating or removing data.
• 不揮発的:データを更新・削除する過程を完了するため、データは読み取り専用である。
Data warehouse supports the types of decision-making at the operational, tactical, and strategic levels. Operational decisions happen frequently based on day-to-day operations and are structured based on a specific predefined role (i.e., limited). Tactical-level decisions occur with greater frequency (i.e., monthly) and are semistructured based on the data requirement. The strategic level has the highest level of organizational business decisions, and their decisions are unstructured and/or infrequent.
英語のヒント
データウェアハウスは、運用・戦術・戦略の各レベルの意思決定を支える。運用上の決定は、日々の業務に基づいて頻繁に行われ、特定の事前定義された役割に基づく構造を持つ、つまり限定されている。戦術レベルの決定は、より高い頻度、たとえば毎月に行われ、データの必要性に応じて半構造化されている。戦略レベルは、組織の事業上の意思決定の最上位であり、構造化されていない、または頻度が低い、あるいはその両方である。
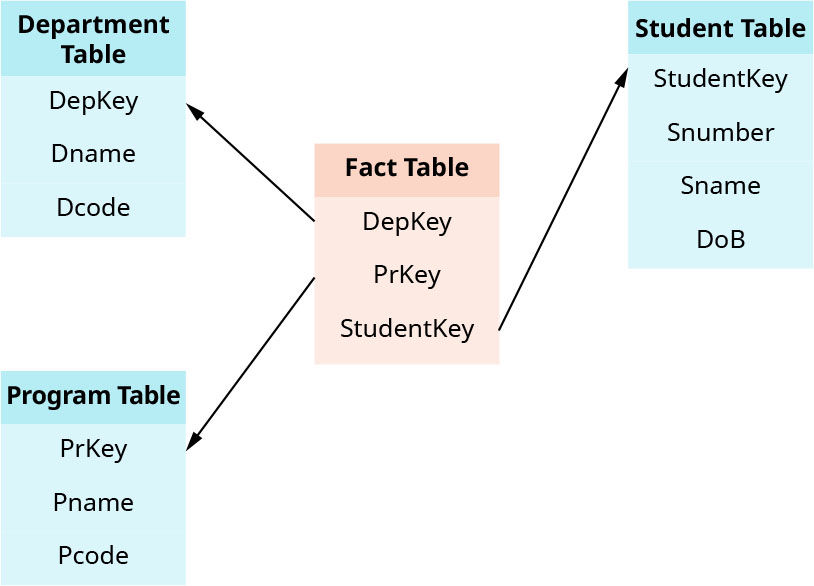
In designing a data warehouse, many schemas can be adopted such as star schema, snowflake schema, and fact constellation. A star schema is a data model with one large fact table connected to smaller tables. The fact table contains keys referring to each dimension table as shown in Figure 8.19.
英語のヒント
データウェアハウスの設計では、スター、スノーフレーク、ファクトコンステレーションなど、多くのスキーマを採用できる。スタースキーマは、1つの大きなファクト表を小さな表と結び付けたデータモデルである。図8.19のように、ファクト表には、各ディメンション表を参照するキーが含まれる。
attribution: Copyright Rice University, OpenStax, under CC BY 4.0 license · CC BY 4.0 · Source出典
Figure 8.19 A graphic shows an example of a star schema. (attribution: Copyright Rice University, OpenStax, under CC BY 4.0 license)
図8.19 スタースキーマの例を示す図。(出典:著作権 Rice University、OpenStax。CC BY 4.0ライセンス)
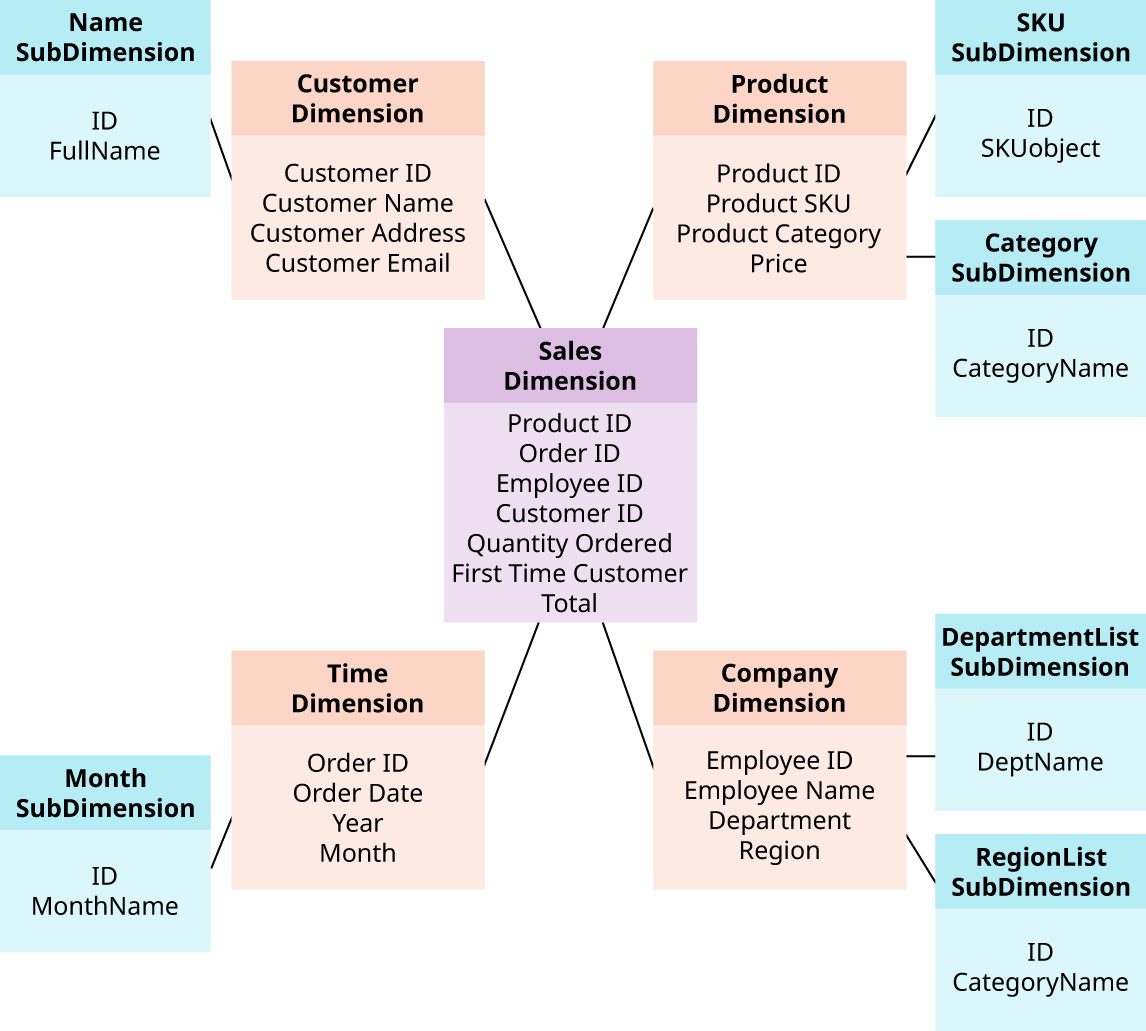
The snowflake schema is a data model that normalizes the dimension table (Figure 8.20). It has one fact table, and it creates smaller tables with primary–foreign key relationships. A fact constellation has more than one fact table connected to other smaller dimension tables.
英語のヒント
スノーフレークスキーマは、ディメンション表を正規化するデータモデルである(図8.20)。ファクト表が1つあり、主キーと外部キーの関係によって、小さな表を作る。ファクトコンステレーションでは、複数のファクト表が、他の小さなディメンション表と結び付く。
attribution: Copyright Rice University, OpenStax, under CC BY 4.0 license · CC BY 4.0 · Source出典
Figure 8.20 This graphic is an example of a snowflake schema. (attribution: Copyright Rice University, OpenStax, under CC BY 4.0 license)
図8.20 スノーフレークスキーマの例。(出典:著作権 Rice University、OpenStax。CC BY 4.0ライセンス)
Extraction, Transformation, and Loading Process抽出・変換・読み込みの過程
After designing the schema, the next process to start is extraction, transformation, and loading (ETL), which is data integration that combines data from multiple sources, fixes the data format, and loads the data into a data warehouse. The first step is extracting the data from the system, which can be full or incremental extraction. Extraction uses change data capture (CDC), which is a technology that detects any data update event.
英語のヒント
スキーマの設計後に始めるのは、抽出・変換・読み込み(ETL)の過程である。複数の情報源のデータを組み合わせ、形式を整え、データウェアハウスへ読み込むデータ統合である。最初の段階は、システムからデータを抽出することで、全件抽出と増分抽出がある。抽出には、データの更新事象を検出する技術である、変更データキャプチャー(CDC)を使う。
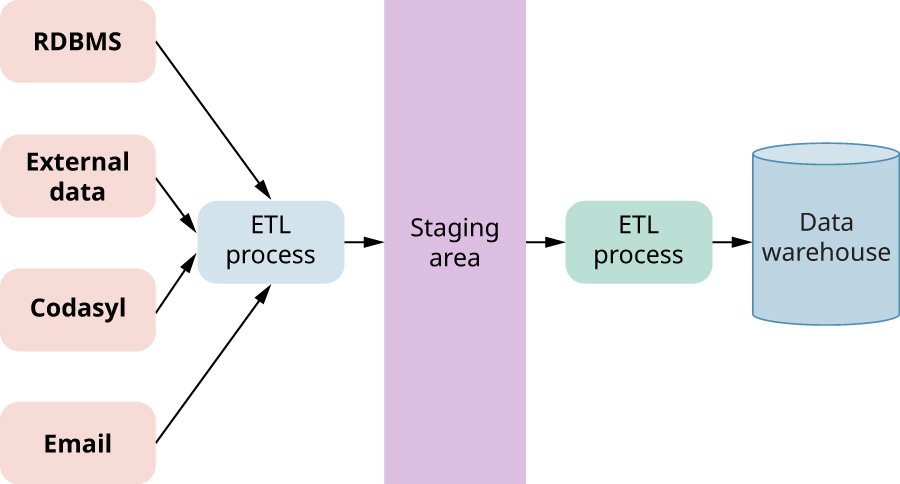
The second step is transforming the data, which includes formatting the data to be consistent, cleansing the data to get rid of missing data, aggregating data by merging some attributes, and enriching by adding external data. The last step is loading the data in parallel as fact and dimension tables to the data warehouse as shown in Figure 8.21. ETL steps will make changes to the data, which should be documented for better understanding and future maintenance. The documentation includes structural metadata about the data structure and semantic metadata about the meaning.
英語のヒント
第2段階はデータの変換である。一貫するように形式を整え、欠損データを取り除くクレンジングを行い、いくつかの属性を結合して集約し、外部のデータを加えて内容を充実させる。最後は、図8.21のように、ファクト表とディメンション表として、データウェアハウスへ並列に読み込む段階である。ETLの各段階ではデータに変更を加えるため、理解しやすくし、将来の保守に役立てるために記録しておく必要がある。記録には、データ構造についての構造メタデータと、意味についての意味メタデータが含まれる。
attribution: Copyright Rice University, OpenStax, under CC BY 4.0 license · CC BY 4.0 · Source出典
Figure 8.21 The extraction, transformation, and loading (ETL) steps of data are shown as the data makes its way to the data warehouse. (attribution: Copyright Rice University, OpenStax, under CC BY 4.0 license)
図8.21 データがデータウェアハウスへ進む際の、抽出・変換・読み込み(ETL)の手順。(出典:著作権 Rice University、OpenStax。CC BY 4.0ライセンス)