付録
The Use of Logarithms and Exponential Numbers対数と指数表示した数の利用
The common logarithm of a number (log) is the power to which 10 must be raised to equal that number. For example, the common logarithm of 100 is 2, because 10 must be raised to the second power to equal 100. Additional examples follow.
英語のヒント
ある数の常用対数(log)とは、10を何乗すればその数になるかを示す指数である。たとえば、100の常用対数は2である。10を2乗すると100になるからである。さらに例を示す。
Logarithms and Exponential Numbers 対数と指数で表した数 |
||
|---|---|---|
Number 数 |
Number Expressed Exponentially 指数で表した数 |
Common Logarithm 常用対数 |
1000 |
103 |
3 |
10 |
101 |
1 |
1 |
100 |
0 |
0.1 |
10−1 |
−1 |
0.001 |
10−3 |
−3 |
What is the common logarithm of 60? Because 60 lies between 10 and 100, which have logarithms of 1 and 2, respectively, the logarithm of 60 is 1.7782; that is,
英語のヒント
60の常用対数はいくつだろうか。60は、それぞれの対数が1と2である10と100の間にあるため、60の対数は1.7782となる。すなわち、
The common logarithm of a number less than 1 has a negative value. The logarithm of 0.03918 is −1.4069, or
1未満の数の常用対数は負の値になる。0.03918の対数は−1.4069であり、次のように表せる。
To obtain the common logarithm of a number, use the log button on your calculator. To calculate a number from its logarithm, take the inverse log of the logarithm, or calculate 10x (where x is the logarithm of the number).
英語のヒント
ある数の常用対数を求めるには、電卓のlogボタンを使う。対数から元の数を計算するには、その対数に対してlogの逆演算を行うか、10xを計算する(xはその数の対数)。
The natural logarithm of a number (ln) is the power to which e must be raised to equal the number; e is the constant 2.7182818. For example, the natural logarithm of 10 is 2.303; that is,
英語のヒント
ある数の自然対数(ln)とは、eを何乗すればその数になるかを示す指数である。eは定数2.7182818である。たとえば、10の自然対数は2.303となる。すなわち、
To obtain the natural logarithm of a number, use the ln button on your calculator. To calculate a number from its natural logarithm, enter the natural logarithm and take the inverse ln of the natural logarithm, or calculate ex (where x is the natural logarithm of the number).
ある数の自然対数を求めるには、電卓のlnボタンを使う。自然対数から元の数を計算するには、その自然対数を入力してlnの逆演算を行うか、exを計算する(xはその数の自然対数)。
Logarithms are exponents; thus, operations involving logarithms follow the same rules as operations involving exponents.
英語のヒント
対数は指数である。したがって、対数を含む演算には、指数を含む演算と同じ規則が成り立つ。
- The logarithm of a product of two numbers is the sum of the logarithms of the two numbers.2つの数の積の対数は、それぞれの数の対数の和に等しい。
- The logarithm of the number resulting from the division of two numbers is the difference between the logarithms of the two numbers.2つの数を割り算して得られる数の対数は、それぞれの数の対数の差に等しい。
- The logarithm of a number raised to an exponent is the product of the exponent and the logarithm of the number.ある数を累乗したものの対数は、その指数と元の数の対数との積に等しい。
The Solution of Quadratic Equations二次方程式の解
Mathematical functions of this form are known as second-order polynomials or, more commonly, quadratic functions.
英語のヒント
この形の関数は二次多項式、より一般的には二次関数と呼ばれる。
The solution or roots for any quadratic equation can be calculated using the following formula:
どの二次方程式でも、その解、すなわち根は、次の公式で計算できる。
Example B.10例題 B.10
Solving Quadratic Equations二次方程式を解く
Solve the quadratic equation 3x2 + 13x − 10 = 0.
二次方程式3x2 + 13x − 10 = 0を解け。
Solution解答
Substituting the values a = 3, b = 13, c = −10 in the formula, we obtain
英語のヒント
a = 3、b = 13、c = −10を公式に代入すると、
The two roots are therefore
したがって、2つの根は次のとおりである。
Quadratic equations constructed on physical data always have real roots, and of these real roots, often only those having positive values are of any significance.
英語のヒント
物理的なデータからつくられる二次方程式は、必ず実数の根をもつ。そして、これらの実数の根のうち、正の値をもつものだけに意味があることが多い。
Two-Dimensional (x-y) Graphing二次元(x-y)のグラフ
The relationship between any two properties of a system can be represented graphically by a two-dimensional data plot. Such a graph has two axes: a horizontal one corresponding to the independent variable, or the variable whose value is being controlled (x), and a vertical axis corresponding to the dependent variable, or the variable whose value is being observed or measured (y).
英語のヒント
ある系の任意の2つの性質の関係は、二次元のデータのプロットによってグラフで表せる。このグラフには2本の軸がある。横軸は独立変数、すなわち値を制御する変数(x)に対応する。縦軸は従属変数、すなわち値を観察または測定する変数(y)に対応する。
When the value of y is changing as a function of x (that is, different values of x correspond to different values of y), a graph of this change can be plotted or sketched. The graph can be produced by using specific values for (x,y) data pairs.
英語のヒント
yの値がxの関数として変化するとき(つまり、xの異なる値がyの異なる値に対応するとき)、その変化のグラフを描くことができる。具体的な(x, y)のデータの組を使って、グラフを作成できる。
Example B.11例題 B.11
Graphing the Dependence of y on xxに対するyの変化をグラフに表す
x |
y |
|---|---|
1 |
5 |
2 |
10 |
3 |
7 |
4 |
14 |
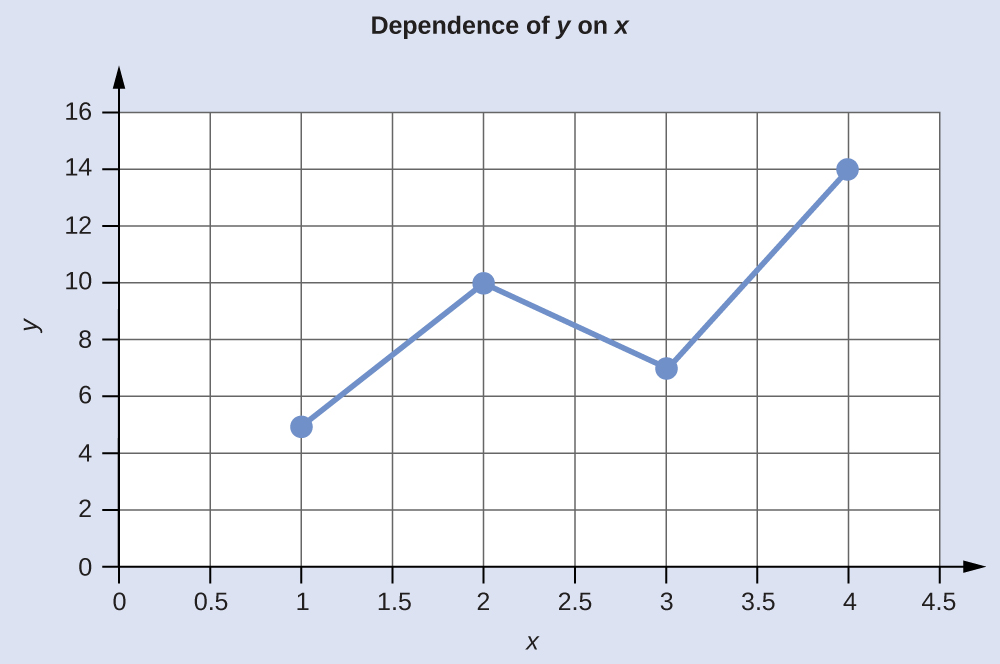
This table contains the following points: (1,5), (2,10), (3,7), and (4,14). Each of these points can be plotted on a graph and connected to produce a graphical representation of the dependence of y on x.
この表には、(1, 5)、(2, 10)、(3, 7)、(4, 14)の点が含まれている。それぞれをグラフ上にプロットしてつなぐと、xに応じてyがどう変わるかをグラフで表せる。
If the function that describes the dependence of y on x is known, it may be used to compute x,y data pairs that may subsequently be plotted.
英語のヒント
xに対するyの依存関係を表す関数がわかっていれば、それを用いてx, yのデータの組を計算し、その後でプロットすることができる。
Example B.12例題 B.12
Plotting Data Pairsデータの組をプロットする
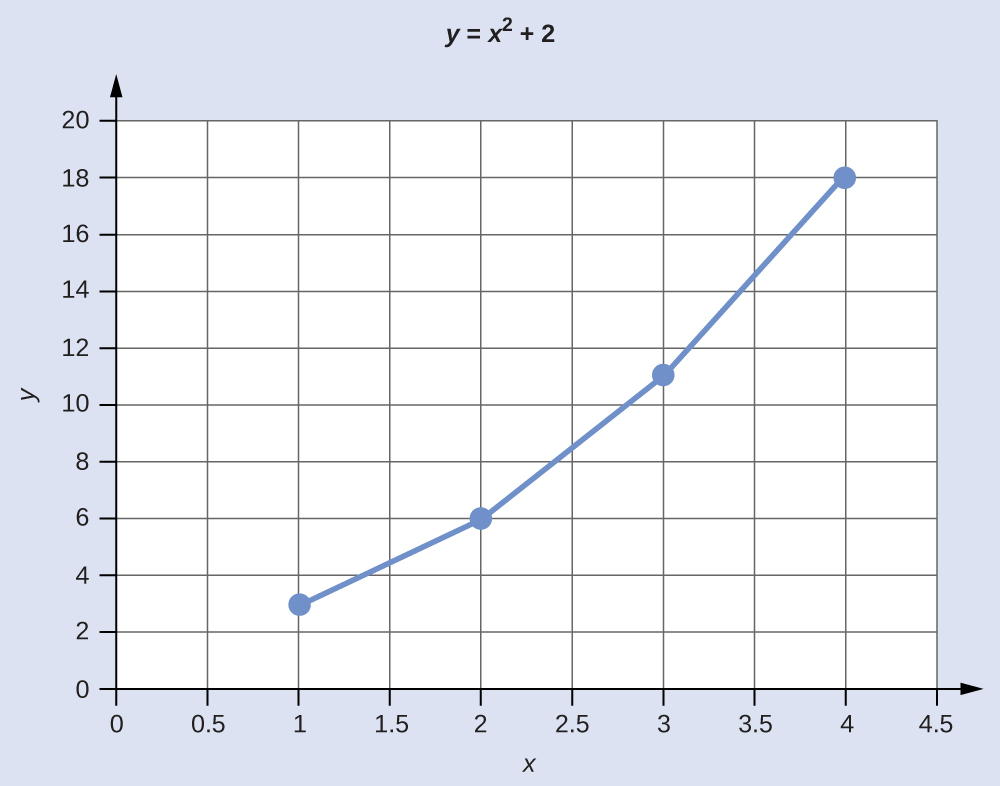
If we know that y = x2 + 2, we can produce a table of a few (x,y) values and then plot the line based on the data shown here.
y = x2 + 2とわかっていれば、いくつかの(x, y)の値を表にまとめ、次に、ここに示したデータに基づいて線を描ける。
x |
y = x2 + 2 |
|---|---|
1 |
3 |
2 |
6 |
3 |
11 |
4 |
18 |