第3章データ構造とアルゴリズム
3.3 Formal Properties of Algorithms3.3 アルゴリズムの形式的性質
Learning Objectives学習目標
By the end of this section, you will be able to:
この節を終えると、次のことができるようになる。
• Understand time and space complexity
・時間計算量と空間計算量を理解する。
• Compare and contrast asymptotic analysis with experimental analysis
・漸近解析と実験による分析を比較し、違いを明らかにする。
• Explain the Big O notation for orders of growth
・増加のオーダーを表すビッグO記法を説明する。
Beyond analyzing an algorithm by examining its outputs, computer scientists are also interested in examining its efficiency by performing an algorithmic runtime analysis, a study of how much time it takes to run an algorithm.
英語のヒント
コンピューター科学者は、出力を調べてアルゴリズムを分析するだけでなく、実行時間の解析によって、その効率を調べることにも関心を持つ。これは、アルゴリズムの実行にどのくらい時間がかかるかを研究することである。
If you have access to a runnable program, perhaps the most practical way to perform a runtime analysis is to time exactly how long it takes to run the program with a stopwatch. This approach, known as experimental analysis, evaluates an algorithm’s runtime by recording how long it takes to run a program implementation of it. Experimental analysis is particularly effective for identifying performance bugs or code that consumes unusually large amounts of computation time or system resources, even though it produces the correct output. In e-commerce, for example, performance bugs that result in slow website responsiveness can lead to millions of dollars in lost revenue. In the worst-case scenario, performance bugs can even bring down entire websites and networks when systems are overloaded and cannot handle incoming requests. As the Internet becomes more heavily used for information and services, performance bugs can have direct impacts on health and safety if the computer infrastructure cannot keep up with demand.
英語のヒント
実行できるプログラムが手元にあれば、おそらく最も実用的な実行時間の分析方法は、ストップウォッチで実行にかかる時間を正確に測ることである。実験による分析と呼ばれるこの方法は、アルゴリズムを実装したプログラムの実行時間を記録して評価する。実験による分析は、性能上のバグ、すなわち出力は正しいのに、計算時間やシステム資源を異常に多く消費するコードを特定するのに、とりわけ有効である。たとえば電子商取引では、性能上のバグでウェブサイトの反応が遅くなると、数百万ドルの売上を失うことがある。最悪の場合、システムが過負荷になって届いた要求を処理できず、ウェブサイトやネットワーク全体が停止することさえある。情報やサービスのためにインターネットがますます利用されるようになると、コンピューターの基盤が需要に追い付けない場合、性能上のバグは健康や安全に直接影響する可能性がある。
While experimental analysis is useful for improving the efficiency of a program, it is hard to use if we do not already have a working program. Programming large systems can be expensive and time-consuming, so many organizations want to compare multiple algorithm designs and approaches to identify the most suitable design before implementing the system. Even with sample programs to represent each algorithm design, we can get different results depending on the processing power, amount of memory available, and other features of the computer that is running the program.
英語のヒント
実験による分析は、プログラムの効率の改善には役立つが、動くプログラムがまだない場合は使いにくい。大規模なシステムのプログラミングには費用と時間がかかるため、多くの組織は、実装に入る前に複数のアルゴリズムの設計や方法を比較し、最適な設計を選びたいと考える。各アルゴリズムの設計を表すサンプルプログラムがあっても、実行するコンピューターの処理能力、利用可能なメモリ量、その他の特性によって、結果が変わることがある。
Designing more efficient algorithms is not just about solving problems more quickly, but about building a more sustainable future. In this section, we will take a closer look at how to formally describe the efficiency of an algorithm without directly executing a working program.
英語のヒント
より効率のよいアルゴリズムを設計することは、単に問題を速く解くことだけでなく、より持続可能な未来を築くことにも関わる。この節では、動くプログラムを直接実行せずに、アルゴリズムの効率を形式的に記述する方法を詳しく見ていく。
CONCEPTS IN PRACTICE概念を実践する
Performance Profiling性能のプロファイリング
Modern computer systems are complicated. Algorithms are just one component in a much larger ecosystem that involves communication between many other subsystems, other computers in a data center, and other systems on the Internet. Algorithmic runtime analysis focuses on the properties of the algorithm rather than all the different ways the algorithm interacts with the rest of the world. But once an algorithm is implemented as a computer program, these interactions with the computing ecosystem play an important role in determining program performance.
英語のヒント
現代のコンピューターシステムは複雑である。アルゴリズムは、ほかの多くのサブシステム、データセンター内のほかのコンピューター、インターネット上のほかのシステムとの通信を含む、はるかに大きな生態系の1つの構成要素にすぎない。アルゴリズムの実行時間解析は、外の世界とのあらゆるやり取りではなく、アルゴリズムそのものの性質に注目する。しかし、一度コンピュータープログラムとして実装されれば、計算機の生態系とのこうした相互作用が、性能を決めるうえで重要な役割を果たす。
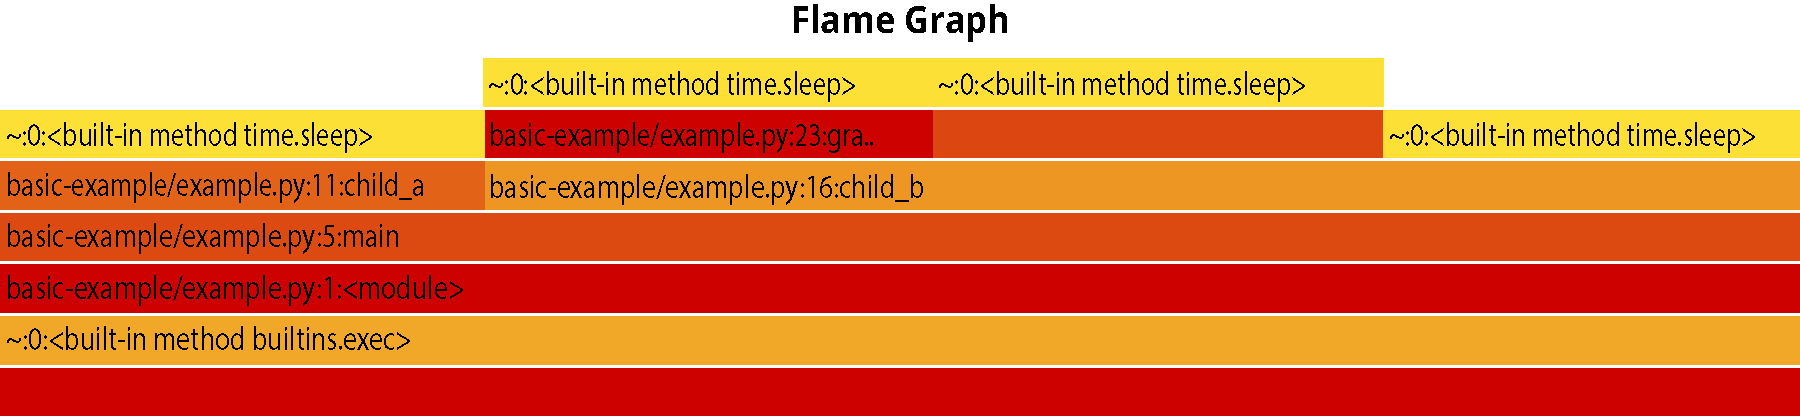
A profiler is a tool that measures the performance (runtime and memory usage) of a program. Profilers are commonly used to diagnose real-world performance issues by producing graphs of how computational resources are used in a program. A common graph is a flame graph (Figure 3.12) that visualizes resource utilization by each part of a program to help identify the most resource-intensive parts of a program. Saving even a few percentage points of resources can lead to significantly reduced time, money, and energy expenditure. As the global demand for computation continues to increase, performance engineers who know how to leverage profilers to analyze systems and implement resource-saving changes will be key to a green energy future.
英語のヒント
プロファイラーは、プログラムの性能、すなわち実行時間やメモリ使用量を測るツールである。プログラムが計算資源をどう使うかをグラフにし、実際の性能問題を診断するために広く利用される。代表的なのがフレームグラフ(図3.12)で、各部分の資源使用を可視化し、資源を最も多く使う部分の特定に役立てる。資源使用を数パーセントポイント減らすだけでも、時間、費用、エネルギー消費を大幅に減らせることがある。世界全体の計算需要が増え続ける中、プロファイラーを活用してシステムを分析し、資源を節約する変更を実装できる性能技術者は、環境に配慮したエネルギーの未来に向けて鍵となる。
attribution: Copyright Rice University, OpenStax, under CC BY 4.0 license · CC BY 4.0 · Source出典
Figure 3.12 A flame graph shows which parts of a program require the most resources. The x-axis shows relative duration and the width indicates the percentage of total duration spent in a function. (attribution: Copyright Rice University, OpenStax, under CC BY 4.0 license)
図3.12 フレームグラフは、プログラムのどの部分が最も多くの資源を必要とするかを示す。x軸は相対的な所要時間を表し、幅は総所要時間のうち関数内で使われた時間の割合を示す。(出典表記:著作権者 Rice University、OpenStax、CC BY 4.0ライセンス)
Time and Space Complexity時間計算量と空間計算量
One way to measure the efficiency of an algorithm is through time complexity, a formal measure of how much time an algorithm requires during execution as it relates to the size of the problem. In addition to time complexity, computer scientists are also interested in space complexity, the formal measure of how much memory an algorithm requires during its execution as it relates to the size of the problem.
英語のヒント
アルゴリズムの効率を測る方法の1つが、時間計算量である。これは、問題のサイズとの関係で、実行中に必要な時間を表す形式的な尺度である。コンピューター科学者は時間計算量に加え、空間計算量にも関心を持つ。これは、問題のサイズとの関係で、実行中に必要なメモリ量を表す形式的な尺度である。
Both time and space complexity are formal measures of the efficiency of an algorithm as it relates to the size of the problem, particularly when we are working with large amounts of complex data. For example, gravity, the universal phenomenon by which things attract and move toward each other, can be modeled as forces that act on every pair of objects in the universe. Simulating a subset of the universe that contains only 100 astronomical bodies will take a lot less time than a much larger universe with billions, trillions, or even more bodies, all of which gravitate toward each other. The size of the problem plays a large role in determining how much time an algorithm requires to execute. We will often express the size of the problem as a positive integer number corresponding to the size of the dataset such as the number of astronomical bodies in our simulation.
英語のヒント
時間計算量も空間計算量も、問題のサイズとの関係でアルゴリズムの効率を形式的に表す尺度であり、とりわけ大量の複雑なデータを扱う際に重要になる。たとえば、物体が互いを引き付け、近付くという普遍的な現象である重力は、宇宙のすべての物体の組に働く力としてモデル化できる。100個の天体だけを含む宇宙の一部分のシミュレーションは、互いに引き合う数十億、数兆、あるいはそれ以上の天体を含む、はるかに大きな宇宙のシミュレーションよりも、所要時間が大幅に短くなる。問題のサイズは、アルゴリズムの実行に必要な時間を決めるうえで大きな役割を果たす。問題のサイズは、たとえばこのシミュレーションの天体の個数のように、データセットの大きさに対応する正の整数で表すことが多い。
The goal of time and space complexity analysis is to produce a simple and easy-to-compare characterization of the efficiency of an algorithm as it relates to the size of the problem. Consider the following description of an algorithm that searches for a target word in a list. Start from the very beginning of the list and check if the first word is the target word. If it is, we have found the word. If it is not, then continue to the next word in the list and repeat the process.
英語のヒント
時間計算量と空間計算量の解析の目標は、問題のサイズとの関係で、アルゴリズムの効率を単純で比較しやすい形に表すことである。リストから目的の単語を探す、次のアルゴリズムの説明を考えよう。リストのいちばん初めから始め、最初の単語が目的の単語かを確認する。そうなら見つかった。そうでなければ次の単語へ進み、同じ処理を繰り返す。
The first task is to identify a metric for representing the size of the problem. Typically, time complexity analysis assumes asymptotic analysis, focusing on evaluating the time that an algorithm takes to produce a result as the size of the input increases. There are two inputs to this algorithm: (1) the list of words, and (2) the target word. The average length of an English word is about five characters, so the size of the problem is primarily determined by the number of words in the list rather than the length of any word. (This assumption might not be right if our dataset was instead a DNA sequence consisting of millions of nucleotides—the time it takes to compare a pair of long DNA sequences might be more important than the number of DNA sequences being compared.) Identifying the size of the problem is an important first task because it determines the other factors we can consider in the following tasks.
英語のヒント
最初の仕事は、問題のサイズを表す尺度を決めることである。時間計算量の解析では通常、漸近解析を想定する。これは、入力サイズが増えるにつれ、結果を生み出すまでの時間がどうなるかを評価することに重点を置く。このアルゴリズムの入力は、(1)単語のリストと(2)目的の単語の2つである。英単語の平均の長さは約5文字なので、問題のサイズは主に、個々の単語の長さではなく、リスト内の単語数で決まる。(データセットが数百万のヌクレオチドからなるDNA配列であれば、この仮定は正しくないかもしれない。長いDNA配列の組を比較する所要時間のほうが、比較するDNA配列の個数より重要かもしれない。)問題のサイズを特定するのは、最初の重要な仕事である。以後の作業で検討できる、ほかの要因がそれによって決まるからである。
The next task is to model the number of steps needed to execute the algorithm while considering its potential behavior on all possible inputs. A step represents a basic operation in the computer, such as looking up a single value, adding two values, or comparing two values. How does the runtime change as the size of the problem increases? We can see that the “repeat” part of our description is affected by the number of words in the list; more words can potentially lead to more repetitions.
英語のヒント
次の仕事は、あり得るすべての入力に対する動作を考慮しながら、実行に必要なステップ数をモデル化することである。ステップは、単一の値を調べる、2つの値を加算する、2つの値を比較する、といったコンピューターの基本操作を表す。問題のサイズが大きくなるにつれ、実行時間はどう変わるだろうか。先の説明で「繰り返す」部分が、リスト内の単語数の影響を受けることがわかる。単語が多ければ、繰り返しが増える可能性がある。
In this case we are choosing a cost model, which is a characterization of runtime in terms of more abstract operations, such as the number of repetitions. Rather than count single steps, we instead count repetitions. Each repetition can involve several lookups and comparisons. By choosing each repetition as the cost model, we declare that the few steps needed to look up and compare elements can be effectively treated as a single operation to simplify our analysis.
英語のヒント
この場合、繰り返し回数など、より抽象的な操作で実行時間を表す、コストモデルを選んでいる。個々のステップではなく、繰り返しの回数を数えるのである。1回の繰り返しには、複数の参照や比較が含まれることがある。それでも各繰り返しをコストモデルの単位にすることで、要素の参照や比較に必要な少数のステップを、解析を単純にするために、実質的に1つの操作として扱うと宣言している。
However, this analysis is not quite complete. We might find the target word early in the list even if the list is very large. Although we defined the size of the problem as the number of words in the list, the size of the problem does not account for the exact words and word ordering in the list. Computer scientists say that this algorithm has a best-case situation when the word can be found at the beginning of the list, and a worst-case situation when the word can only be found at the end of the list (or, perhaps, not even in the list at all). One way to account for the variation in runtime is via case analysis, which is based on factors other than the size of the problem.
英語のヒント
しかし、これだけでは解析はまだ十分でない。リストがとても大きくても、目的の単語が早い段階で見つかるかもしれない。問題のサイズをリスト内の単語数と定義したが、それには具体的な単語や並び順は含まれない。コンピューター科学者は、単語がリストの先頭で見つかる状況を、このアルゴリズムの最良の場合、末尾でようやく見つかる、あるいはリスト内にまったくない状況を最悪の場合と呼ぶ。実行時間のばらつきを扱う1つの方法が、問題のサイズ以外の要因に基づく、場合分けによる解析である。
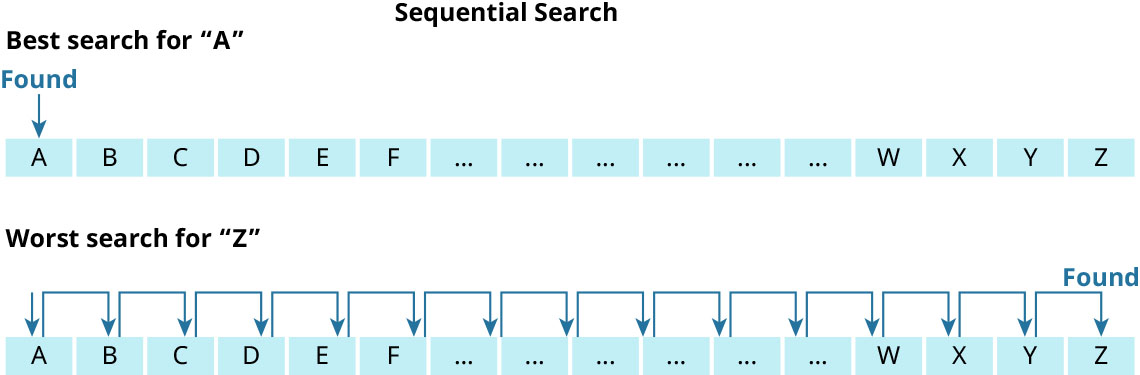
Finally, we can formalize our description using either precise English or a special mathematical notation called Big O notation, which is the most common type of asymptotic notation in computer science used to measure worst-case complexity. In precise English, we might say that the time complexity for this sequential search algorithm has two cases (Figure 3.13):
英語のヒント
最後に、正確な英語の記述、またはビッグO記法という特殊な数学記法を使って、説明を形式化できる。ビッグO記法は、コンピューターサイエンスで最悪時の計算量を測るために最もよく使われる漸近記法である。この逐次探索の時間計算量について、正確な英語で述べれば、次の2つの場合があると言える(図3.13)。
• In the best-case situation (when the target word is at the start of the list), sequential search takes just one repetition to find the word in the list.
・最良の場合(目的の単語がリストの先頭にある場合)、逐次探索は1回の繰り返しだけで単語を見つける。
• In the worst-case situation (when the target word is either at the end of the list or not in the list at all), sequential search takes N repetitions where N is the number of words in the list.
・最悪の場合(目的の単語がリストの末尾にあるか、まったく含まれていない場合)、逐次探索にはN回の繰り返しが必要になる。ここでNはリスト内の単語数である。
attribution: Copyright Rice University, OpenStax, under CC BY 4.0 license · CC BY 4.0 · Source出典
Figure 3.13 The best case for sequential search in a sorted list is to find the word at the top of the list, whereas the worst case is to find the word at the bottom of the list (or not in the list at all). (attribution: Copyright Rice University, OpenStax, under CC BY 4.0 license)
図3.13 整列したリストで逐次探索を行う最良の場合は、リストの先頭で単語が見つかる場合である。最悪の場合は末尾で見つかる場合、またはリスト内にまったくない場合である。(出典表記:著作権者 Rice University、OpenStax、CC BY 4.0ライセンス)
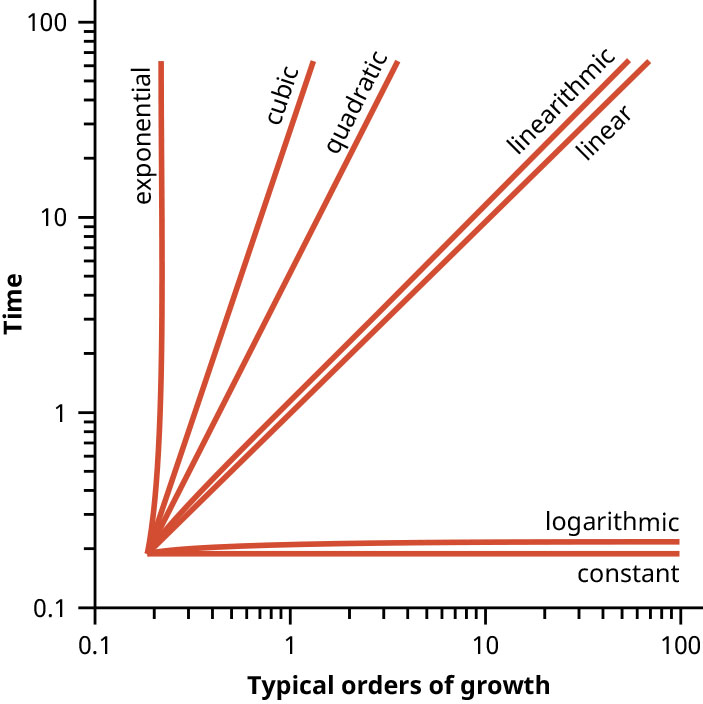
While this description captures all the ideas necessary to communicate the time complexity, computer scientists will typically enhance this description with mathematics to convey a geometric idea of the runtime. The order of growth is a geometric prediction of an algorithm’s time or space complexity as a function of the size of the problem (Figure 3.14).
英語のヒント
この説明には、時間計算量を伝えるのに必要な考え方がすべて含まれているが、コンピューター科学者は通常、実行時間についての幾何学的な見方を伝えるために、数学を使って説明を補強する。増加のオーダーとは、問題のサイズの関数として、時間計算量や空間計算量がどうなるかを幾何学的に予測したものである(図3.14)。
• In the best case, the sequential search has a constant order of growth that does not take more resources as the size of the problem increases.
・最良の場合、逐次探索の増加のオーダーは定数であり、問題のサイズが増えても、使う資源は増えない。
• In the worst case, the sequential search has a linear order of growth where the resources required to run the algorithm increase at about the same rate as the size of the problem increases. This is with respect to N, the number of words in the list.
英語のヒント
・最悪の場合、逐次探索の増加のオーダーは線形であり、実行に必要な資源は、問題のサイズとほぼ同じ割合で増える。これは、リスト内の単語数Nについての関係である。
Constant and linear are two examples of orders of growth. An algorithm with a constant order of growth takes the same amount of time to execute even as the size of the problem grows larger and larger—no matter how large the dictionary is, it is possible to find the target word at the very beginning. In contrast, an algorithm with a linear time complexity will take more time to execute as the size of the problem grows larger, and we can predict that an increase in the size of the problem corresponds to roughly the same increase in the runtime.
英語のヒント
定数と線形は、増加のオーダーの2つの例である。増加のオーダーが定数のアルゴリズムは、問題のサイズがどれほど大きくなっても、同じ時間で実行できる。辞書がどれほど大きくても、目的の単語を最初に見つけることはあり得る。これに対し、時間計算量が線形のアルゴリズムは、問題のサイズが大きくなると、実行時間も長くなる。そして、問題のサイズの増加に対して、実行時間もおよそ同じ割合で増えると予測できる。
This prediction is a useful outcome of time complexity analysis. It allows us to estimate the runtime of the sequential search algorithm on a problem of any size, before writing the program or obtaining a dictionary of words that large. Moreover, it helps us decide if we want to use this algorithm or explore other algorithm designs and approaches. We might compare this sequential search algorithm to the binary search algorithm and adjust our algorithm design accordingly.
英語のヒント
この予測は、時間計算量解析から得られる有用な成果である。プログラムを書いたり、その規模の単語辞書を入手したりする前に、任意のサイズの問題で、逐次探索の実行時間を見積もれる。さらに、このアルゴリズムを使うか、別の設計や方法を探るかを判断する助けにもなる。逐次探索と二分探索を比べ、結果に応じて設計を調整することもできる。
attribution: Copyright Rice University, OpenStax, under CC BY 4.0 license · CC BY 4.0 · Source出典
Figure 3.14 The order of growth of an algorithm is useful to estimate its runtime efficiency as the input size increases (e.g., constant, logarithmic, and other orders of growth) to help determine which algorithmic approach to take. (attribution: Copyright Rice University, OpenStax, under CC BY 4.0 license)
図3.14 アルゴリズムの増加のオーダー(定数、対数、その他)は、入力サイズが大きくなったときの実行時間の効率を見積もり、どの方法を採るか判断するのに役立つ。(出典表記:著作権者 Rice University、OpenStax、CC BY 4.0ライセンス)